Introduction:
The cooling process in a car’s air conditioning system uses changes of state of a substance. During a change of state, such as the transition from liquid to vapour, the molecular structure of the substance changes and heat is required. Heat is absorbed when liquid changes into vapour, and in the opposite case, during the transition from vapour to liquid, heat is released.
If we look at the heat transfer to and from the surroundings, we see that during the evaporation process the surroundings cool down, while heat is released and the surroundings warm up during condensation. This cooling of the surroundings occurs in the evaporator, while heating takes place in the condenser. This process is repeated continuously, which is why it is known as a cycle process.
On the page “Air conditioning introduction”, the cycle process with the various components of the air conditioning system is described in a practical way. On this page we will further explore this cycle process by means of the log pH diagram.
Cycle process:
Before a complete log pH diagram is discussed, the cycle process of an air conditioning system is first explained. The refrigerant R134a is used here. In the diagram, the regions for gas, mixture region (gas and liquid) and liquid are distinguished from one another. The critical point is located at the top of the diagram, at approximately 101 °C and a pressure of about 40 bar. Above this point, there is no longer any distinction between liquid and gas.
On the horizontal axis is the enthalpy (heat content) in kJ/kg. On the vertical axis is the pressure in bar, shown on a logarithmic scale. That is why it is called a log pH diagram. Next to the diagram is a brief explanation of the points shown. The detailed explanation is given below the diagram.
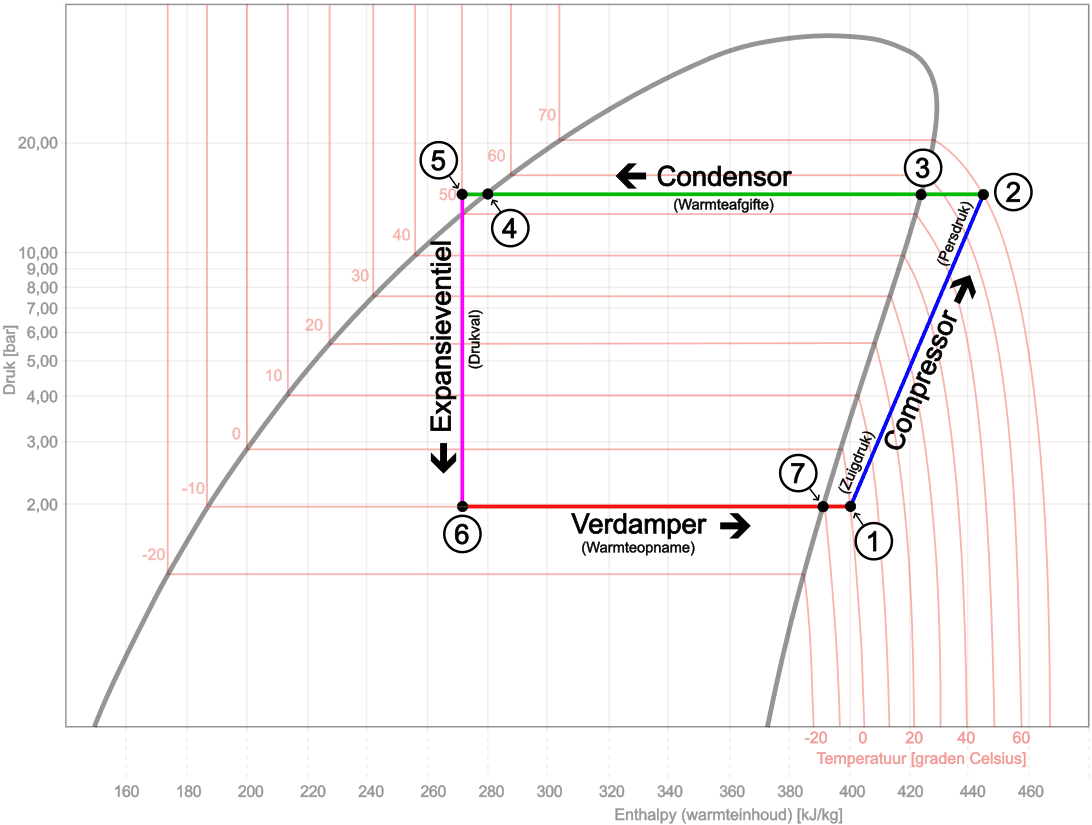
1 → 2: Compressor
Discharge pressure, superheating
2 → 3: Refrigerant flows to the condenser. Superheat is reduced.
3 → 4: Condenser
Heat rejection, condensation, subcooling
4 → 5: Subcooling
Liquid is cooled down further
5 → 6: Expansion valve
Pressure drop, strong temperature decrease
6 → 7: Evaporator
Heat absorption, evaporation, superheating
7 → 1: Superheating
Vapour is heated further.
Process progression:
- Point 1: the refrigerant leaves the evaporator as gas and is drawn in by the compressor at low pressure (suction pressure), approximately 2 bar and a temperature around 0 °C. The gas is slightly superheated at this point;
- From point 1 to point 2 the gas is compressed by the compressor. As a result, the pressure and temperature increase sharply. The refrigerant leaves the compressor as superheated vapour at high pressure (discharge pressure), approximately 15 bar and about 70 °C;
- From point 2 to point 3 the refrigerant flows through the condenser. Here it gives off heat to the surroundings. In this trajectory, the superheat is first reduced: the superheated vapour cools down to saturated vapour, with the temperature dropping from about 70 °C to around 55 °C;
- From point 3 to point 4 the refrigerant condenses at an almost constant pressure and temperature (about 15 bar and 55 °C). The gas is converted into liquid. This is the condensation process;
- From point 4 to point 5 the liquid is cooled down further. The liquid becomes subcooled; this is also called subcooling. The temperature drops, for example, from about 55 °C to around 50 °C, while the pressure remains about 15 bar. With the subcooling we determine whether all the refrigerant in the condenser has completely condensed.
Too little subcooling:
– gas is still leaving the condenser
– evaporator will not operate optimallyToo much subcooling:
– the refrigerant has condensed too quickly
– too little refrigerant in the AC systemCalculating subcooling (normally 5 to 15 ˚C): HD_condensation temp – T_condenser outlet
- At point 5 the refrigerant reaches the expansion valve (or capillary tube). Here the expansion begins. In this component the high pressure (discharge pressure of about 15 bar) is separated from the low pressure (suction pressure of about 2 bar);
- From point 5 to point 6 the pressure reduction takes place. The pressure suddenly drops from about 15 bar to around 2 bar. As a result, the temperature also drops sharply, for example from about 50 °C to around -10 °C. Part of the liquid evaporates immediately, creating a mixture of liquid and gas. The enthalpy (shown on the x-axis) remains almost constant;
- From point 6 to point 7 the refrigerant flows through the evaporator. Here evaporation takes place at an almost constant pressure (about 2 bar) and temperature (around -10 °C). The mixture of liquid and gas is completely converted into saturated vapour;
- From point 7 to point 1 the vapour is heated further. We call this superheating. The temperature rises from about -10 °C to around 0 °C, while the pressure remains almost constant. With the superheating we determine whether all the refrigerant in the evaporator has completely evaporated.
Too little superheating:
– liquid is leaving the evaporator
– high risk for the compressor;
Too much superheating:
– the refrigerant has evaporated too early
– air conditioning does not get cold enoughCalculating superheating (normally 4 to 7 ˚C): T_evaporator outlet – LD_evaporation temp.
The refrigerant reaches point 1 as slightly superheated vapour and is drawn in again by the compressor. The process repeats.
Log pH diagram:
In the previous paragraph the log pH diagram was shown with the cycle process (from evaporating to condensing the refrigerant). The image below shows the state of the refrigerant at a certain pressure in relation to the enthalpy (heat content), in which the cycle process is indicated by the dark blue line.
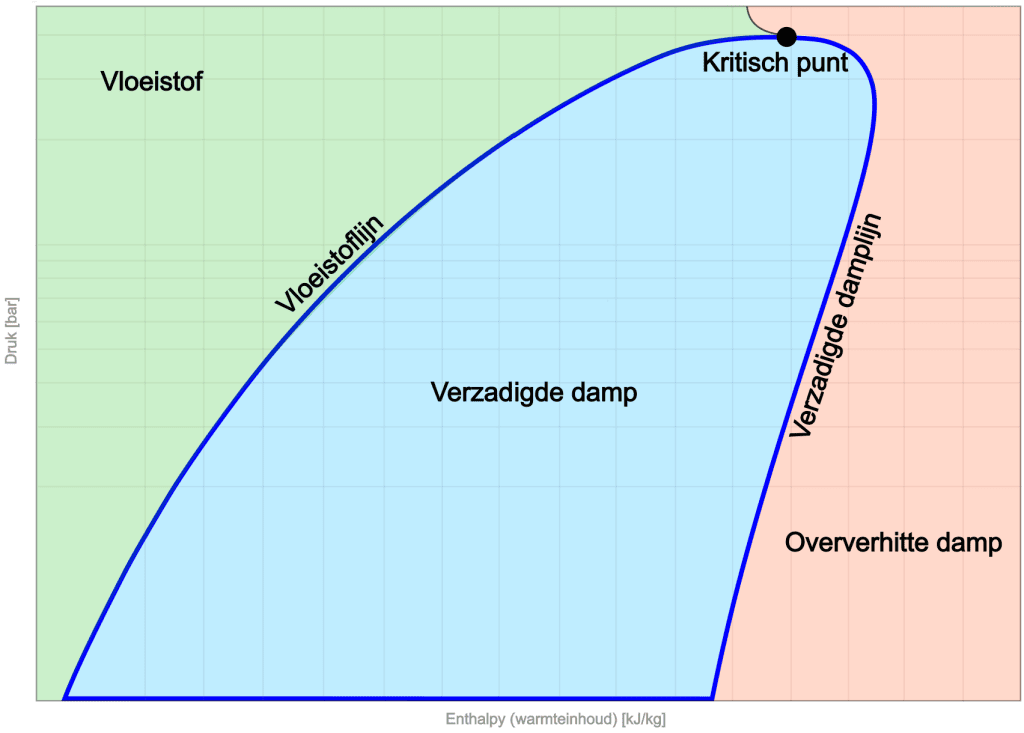
On the left side of the diagram is the liquid region. At low enthalpy, the refrigerant is in liquid form. With increasing enthalpy, the liquid line is reached. The slope of this line indicates the changes in pressure and enthalpy for the liquid phase.
In the middle of the diagram is the saturated vapour zone. Here the refrigerant is in thermal equilibrium, with both liquid and vapour present.
On the right-hand side we see the saturated vapour line, which marks the boundary where the refrigerant is fully evaporated and in a superheated vapour phase.
At the top of the diagram is the critical point, which indicates the boundary between liquid and vapour. Here the distinction between vapour and liquid phases disappears, causing the refrigerant to be in a unique state. There is no clear transition between liquid and vapour here.
To give more insight into the log pH diagram, several curves are added to the diagram below: the isentropic, isothermal, isochoric and the vapour quality. In the drawing below we again see the cycle process (in grey) with the course of the other processes. A brief explanation of each change of state follows:
Isentropic: an isentropic line is characterised by a constant entropy. This means that the refrigerant undergoes no heat exchange with the surroundings and no change in entropy during a process along this line. It is an efficient adiabatic (without heat exchange) process line in the diagram.
Isothermal: An isothermal line in the log pH diagram represents a constant temperature process. During this process, the temperature of the refrigerant remains constant, which means that heat is supplied or removed in order to keep the pressure-enthalpy (pH) ratio constant.
Isochoric: An isochoric line in the log pH diagram represents a constant volume process. During this process, the specific volume of the refrigerant remains constant, which means that no change in volume occurs. As a result, the line can go steeply up or down in the diagram, depending on other changes such as pressure and enthalpy.
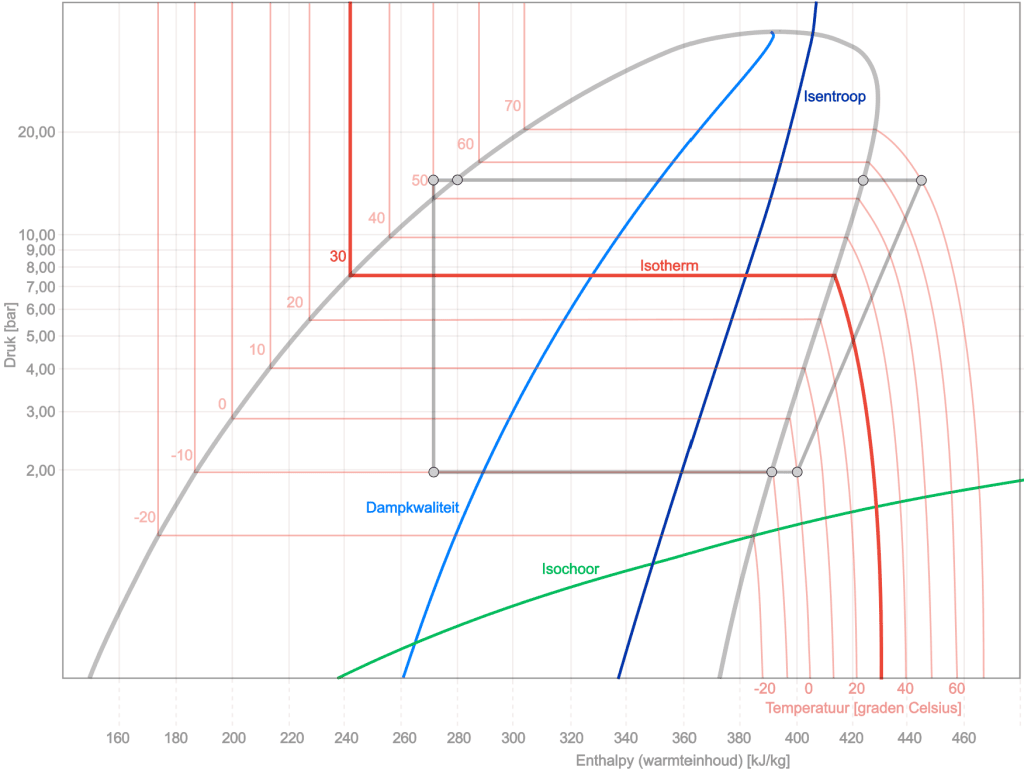
- Vapour quality: In a log pH diagram of refrigerant, the x-axis indicates the quality range, from “x=0” (completely liquid) to “x=1” (completely gaseous). Between these extremes, the refrigerant is in a two-phase state, where the x-value indicates the ratio of gas to liquid. A line from “x=0.10” to “x=0.90” in the diagram indicates that the refrigerant is within this two-phase range, with the specific x-value indicating the distribution between gas and liquid. This is crucial for understanding the behaviour of the refrigerant in applications such as cooling and air conditioning systems.
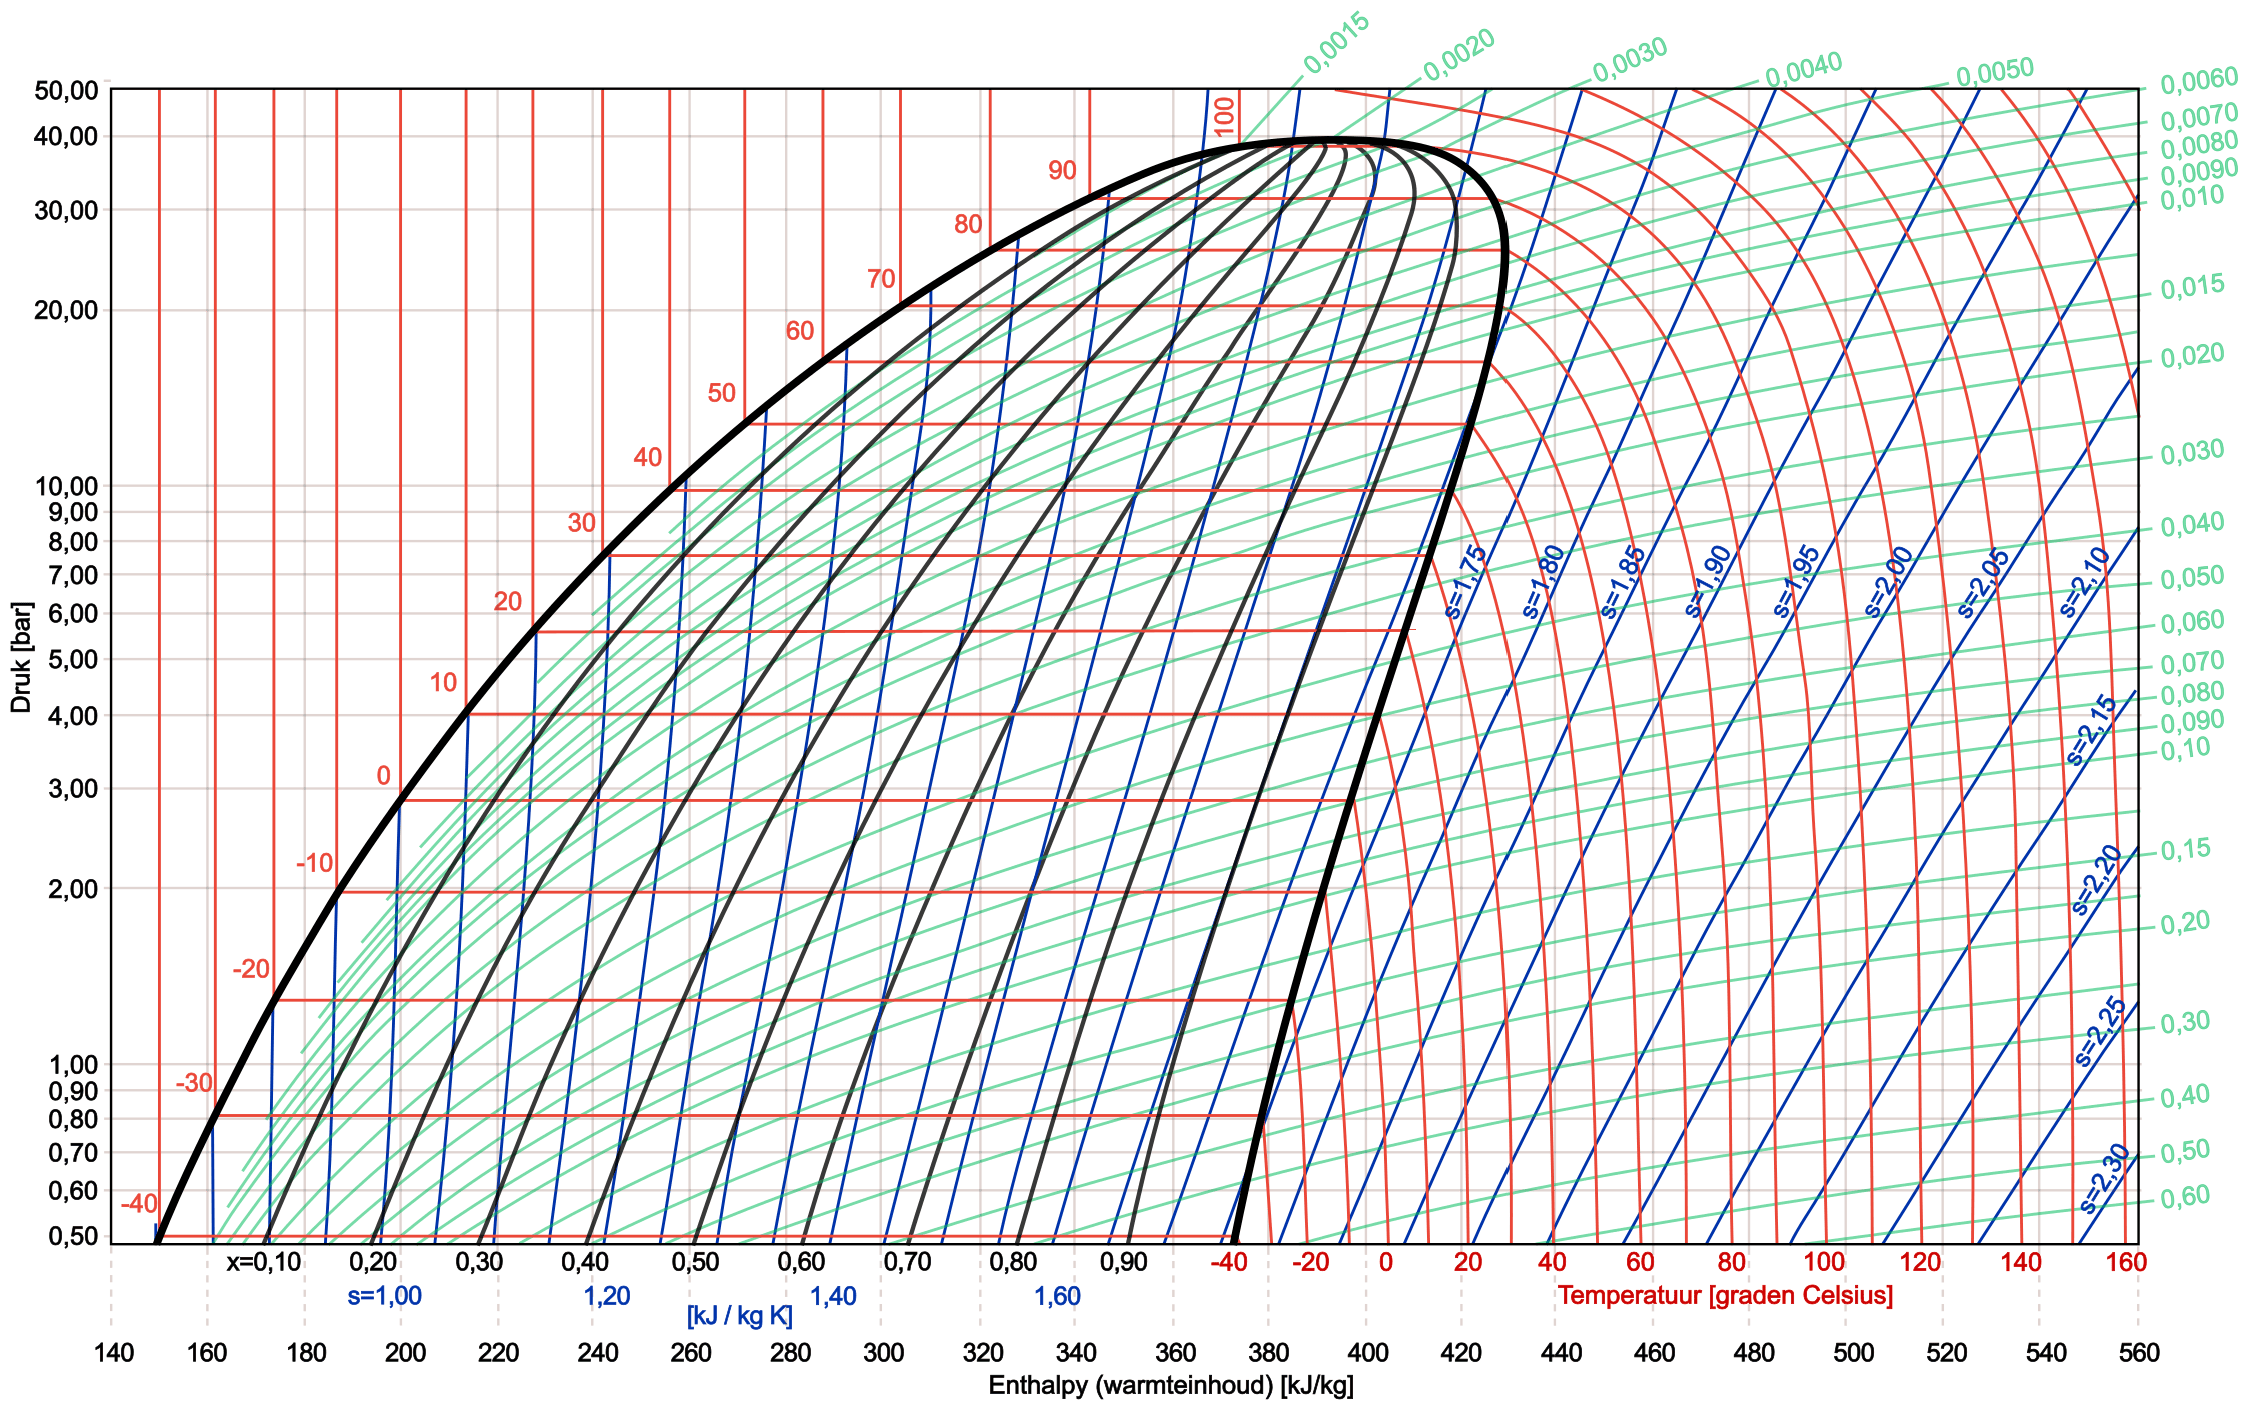
In the image below we see a complete log pH diagram of the refrigerant R134a.
Comparing R134a with R1234yf:
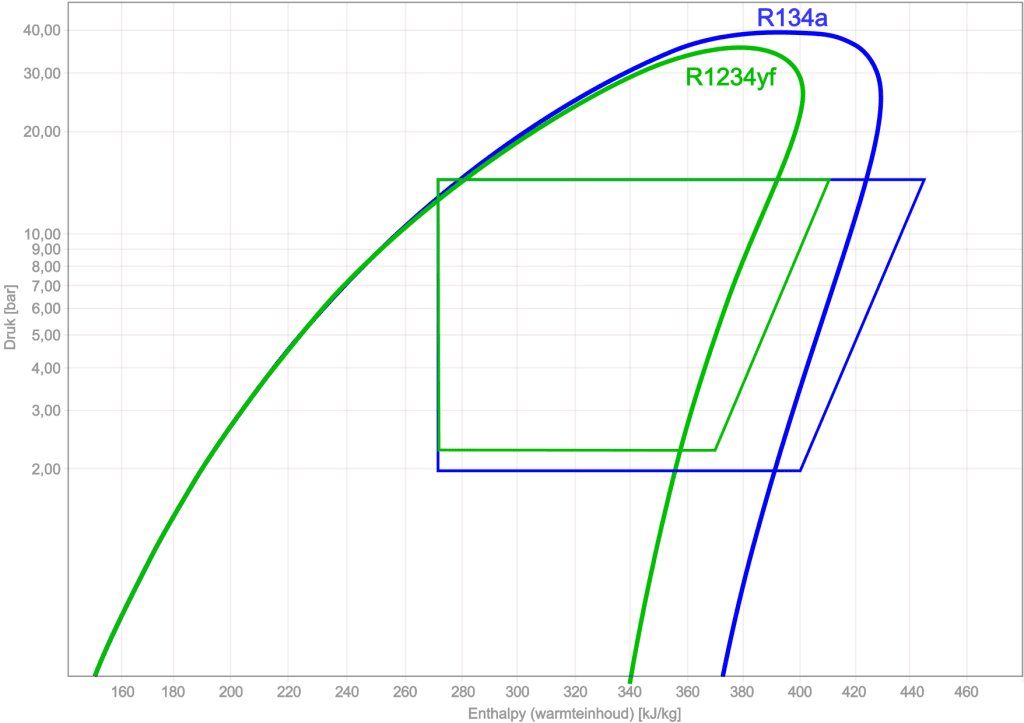
Using the log pH diagram, different types of refrigerants can be compared with one another. The following image shows the log pH diagrams and the cycle processes of R134a and R1234yf.
Related page: