Introduction:
An in-cylinder pressure measurement is a measurement method that visualizes the pressure change in a combustion engine cylinder throughout the entire engine cycle. With this measurement, a compression test can be performed in which, just as with a conventional compression test, the pressure at the end of the compression stroke is determined. In addition, an in-cylinder pressure test makes it possible to analyze the complete pressure pattern during the intake, compression, power and exhaust strokes.
A commonly used measuring tool nowadays to measure the pressure in the cylinder is the WPS500x pressure transducer from PicoScope. Besides this brand, there are also similar pressure sensors available from, among others, Fluke and some less common brands. Because the WPS500x is very popular in automotive workshops as of 2026 and is also used in national practical exams, we focus on this page specifically on the scope images recorded with this measuring system.
The WPS500x is a high-resolution pressure sensor that is mounted directly in the combustion chamber, in the cylinder head, by means of a spark plug adapter (petrol engine), glow plug adapter or injector adapter (diesel engine). The sensor converts the existing cylinder pressure into an electrical signal. This signal is displayed by the PicoScope as a pressure graph, plotted against time or against crankshaft position. In the software, the WPS500x can be selected, after which the Y-axis changes from Volts to Bar.
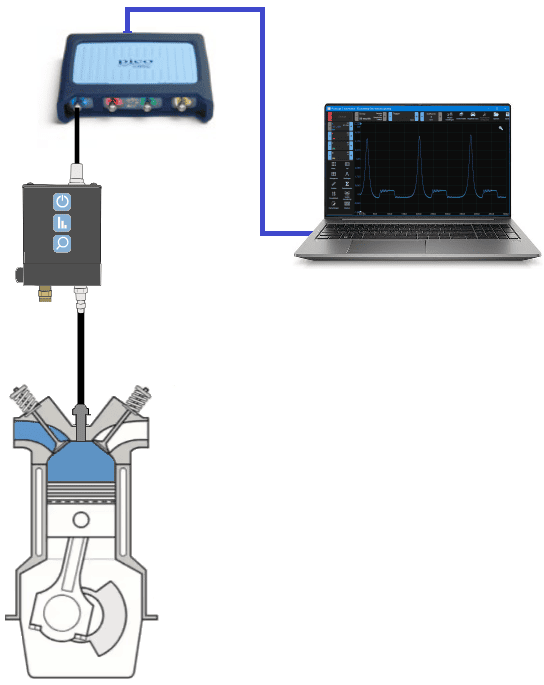
The image alongside shows a WPS500x setup on an automotive scope which is connected to a laptop with a USB cable.
The laptop displays a measurement of the pressure pattern with the engine running. Both the fuel injection and ignition of the cylinder are disabled, so the piston only causes an air displacement without combustion taking place. For the mechanic or technical specialist, it is interesting to see how much vacuum is present during the intake stroke and how much overpressure is present during the compression, power and exhaust strokes.
The following sections explain how the pressure pattern during cranking and running of the engine can be read, what the different regions show, how possible faults in the four-stroke process can be recognized and which steps can be taken to find the cause.
Pressure pattern with idling engine:
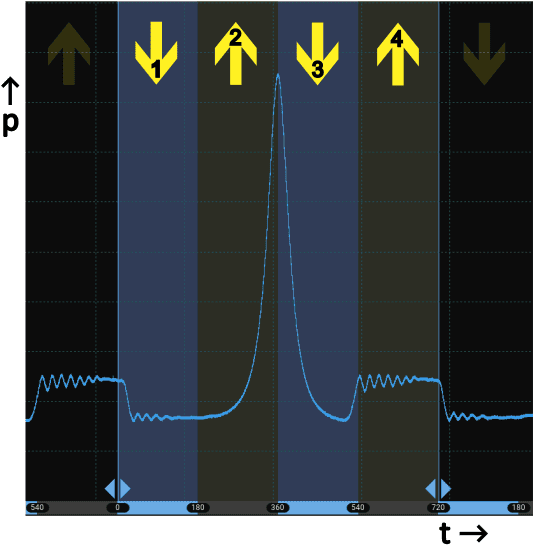
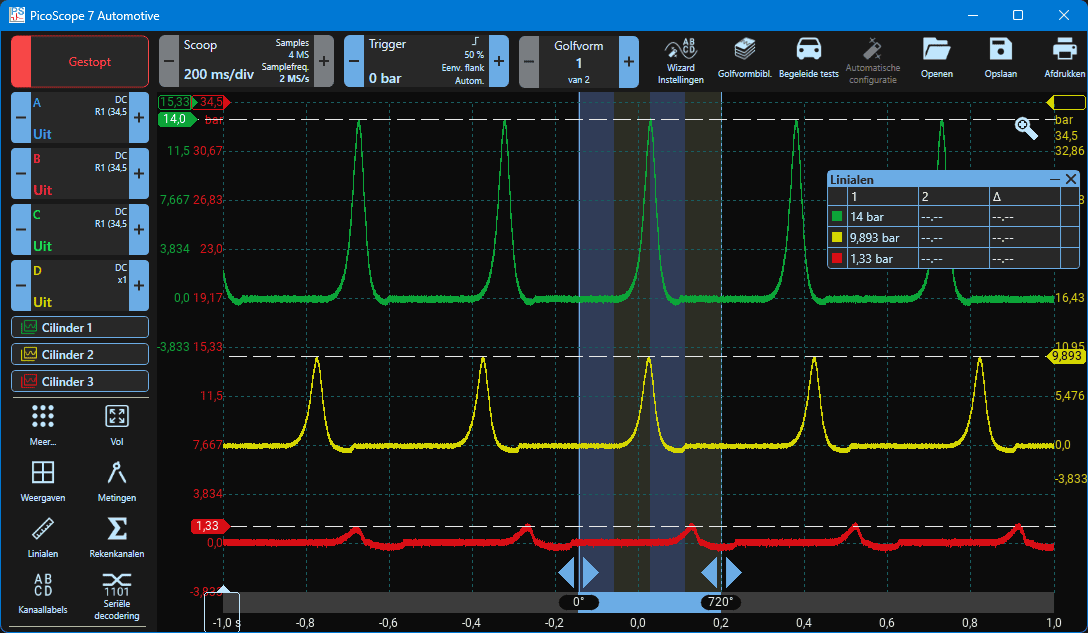
Once the measuring equipment has been connected, the injection and ignition of the cylinder to be measured have been disabled and the engine is idling, the pressure pattern (p) relative to time (t) is created as shown in the image on the right.
The blue-grey coloured boxes are placed using a setting in PicoScope by selecting “Phase rulers” under “Rulers” and choosing 720 degrees. The rulers are aligned with the pressure peaks of the compression strokes, which remain visible with a running engine without combustion. Below, the pressure pattern in the different phase rulers is explained with the yellow numbered arrows.
- Intake stroke: between 0 and 180 crankshaft degrees. In this area there is a vacuum in the cylinder to draw in the intake air;
- Compression stroke: at t = 180 degrees the pressure build-up of the compression stroke begins up to the top of the pressure peak. At 360 degrees the end of the compression stroke is reached;
- Power stroke: the piston moves from TDC to BDC. Note: this is not literally a power stroke but the expansion of the air volume, because no combustion takes place;
- Exhaust stroke: at t = 540 crankshaft degrees the piston moves towards TDC and a slight overpressure occurs: here the exhaust valve is open and the gases are expelled. At t = 720 degrees the intake stroke of the next cycle begins again.
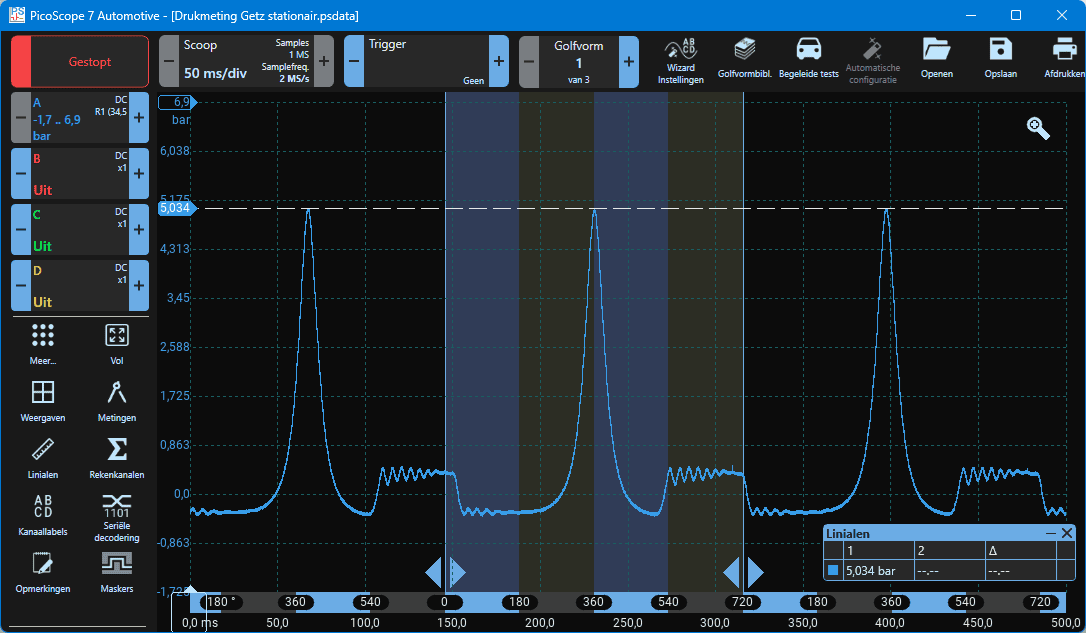
The complete scope image with the corresponding settings is shown below. The end-of-compression pressure is approximately 5 bar and is indicated by the ruler. Because the engine is idling, the throttle valve is almost closed due to the active idle control. As a result, less air is drawn into the cylinder, the manifold pressure is around 30 to 40 kPa and the cylinder’s volumetric efficiency is low, which results in a lower compression pressure.
Pressure pattern during engine cranking:
Just as with an idling engine, during cranking the injection and ignition of the respective cylinder must be disabled. To allow as much air as possible to flow into the cylinder, the throttle must be fully opened during cranking:
- Engines with an electronically controlled accelerator pedal in combination with direct injection and variable valve lift: the throttle may already be opened fully automatically during cranking;
- Engines with a throttle cable (Bowden cable): in this case the accelerator pedal must be fully depressed or, under the bonnet, the throttle plate must be opened by hand.
During cranking, the end-of-compression pressure will be displayed on the scope. This compression test is comparable to the conventional method with the compression gauge: the same end pressure will be displayed. The end-of-compression pressure can be seen in the pattern in the image below. For the same engine where the compression pressure at idle was (only) 5 bar, the pressure during cranking is about 14 bar, which is a good value for this engine. This measurement can be repeated for each cylinder to see the differences between them.
Pressure pattern during cranking with compression loss:
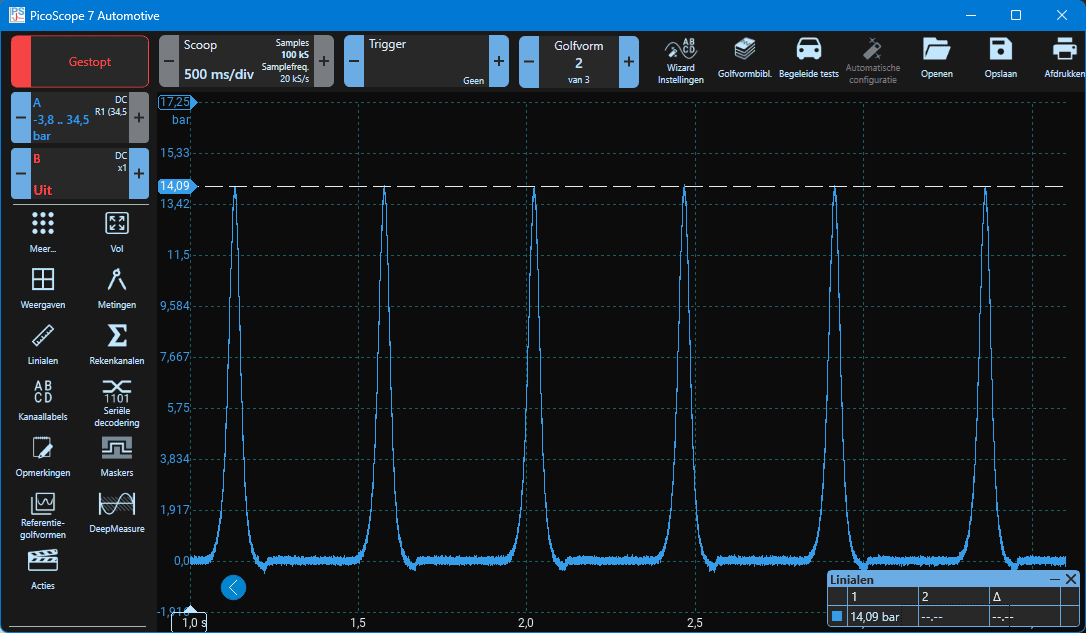
During cranking with the throttle open we see the end-of-compression pressure at each compression stroke on the scope image. When compression loss is suspected, we connect the pressure sensor to a different cylinder after each measurement. In this experiment, measurements were taken on an engine on which engine damage was intentionally created in order to properly practice such measurements.
- Cylinder 1: an end-of-compression pressure of 14 bar. That is OK and also serves as the reference for the other cylinders that must be measured;
- Cylinder 2: the end-of-compression pressure is not even 10 bar. Here we are dealing with compression loss;
- Cylinder 3: in this trace, only a minimal pressure increase of 1.33 bar can be seen. This means that hardly any air pressure is being built up and there is a high probability of serious damage here.
Below the scope image we zoom in further on the pressure pattern of the green and yellow curves (cylinders 1 and 2), looking at the rise-rate and fall-rate times.
With the rulers we can make the difference in rise-rate and fall-rate time visible.
- Vertical ruler 1: across the width of the top peak pressure (t = 729.3 ms)
- Horizontal ruler 1: at the height of the top peak pressure (p = 13.83 bar)
- Horizontal ruler 2: halfway up the rising pressure (p = 6.89 bar)
- Vertical ruler 2: at the tangent point between the graph and horizontal ruler 2.
In the scope images below the tangent points of the rulers are indicated with red dots. Using these we can determine the rise-rate time (t1) and fall-rate time (t2). The explanation of the scope image with the green curve (cylinder 1) continues below the image.
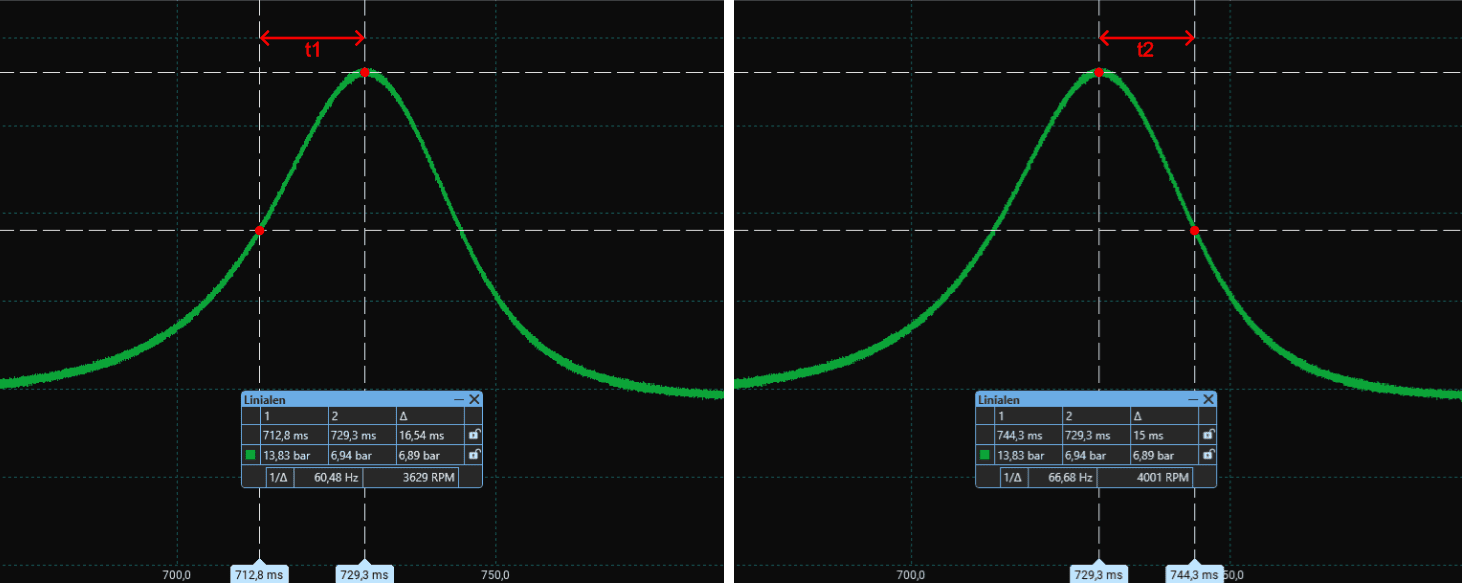
Using the horizontal and vertical rulers, the time differences can be determined precisely. In the above scope image (of cylinder 1) we read the following times from the rulers:
- t1: 16.54 ms
- t2: 15 ms
The time difference between t2 and t1 is: (16.54 – 15) 1.54 ms. This is characteristic of a properly functioning engine: the rise and fall-rate times are almost equal. The expansion (TDC -> BDC) is slightly faster than the compression (BDC -> TDC): it takes more effort (and therefore time) to compress the air than to let the air pressure help push the piston back down to BDC.
The explanation of the yellow curve (cylinder 2) continues below the image.
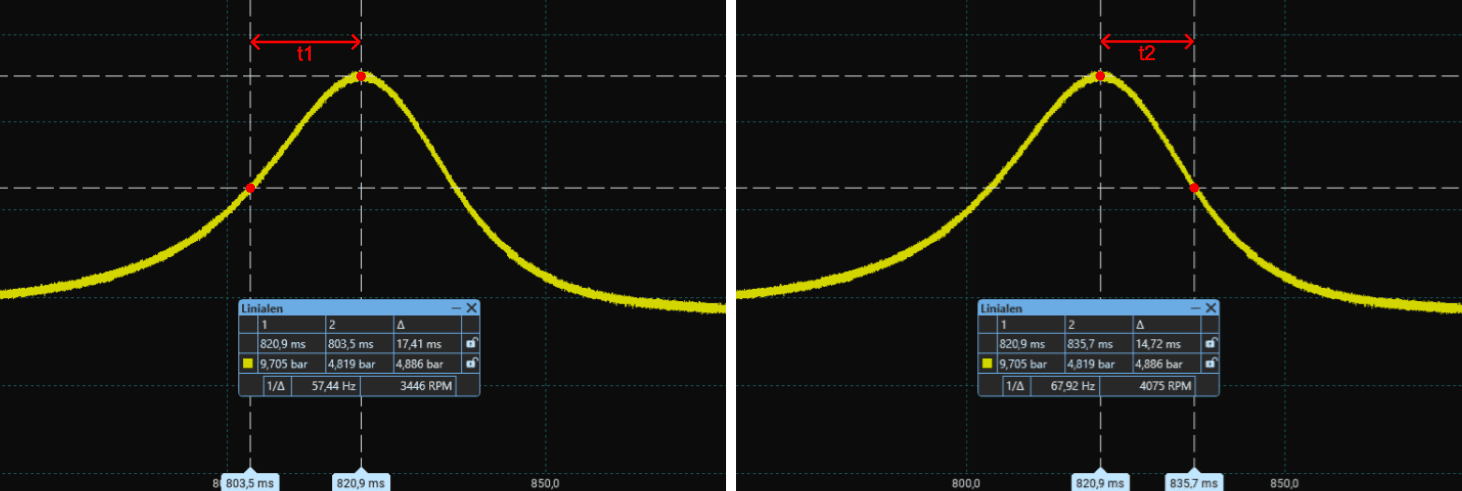
In the above scope image of cylinder 2 the time difference between t2 and t1 is 2.69 ms. This time difference is greater than in the cylinder without compression loss, which means that the pressure build-up and decay do not proceed at the same rate. One of the flanks is steeper or flatter than the other. This indicates compression loss in the cylinder.
The causes of compression loss are diverse. There are many possibilities for air leakage in the combustion chamber, of which these are the most common practical examples:
- burned intake or exhaust valve;
- worn compression rings;
- scoring in the cylinder wall, preventing proper sealing between piston and cylinder;
- defective head gasket;
- cracked or broken piston;
- crack in the cylinder head;
- leakage along the injector.
When there is a loss of compression, additional measurements can be used to determine where the air leakage occurs. With burnt valves, an air pulse can be measured in the intake manifold or in the exhaust system. This can be done with both the WPS500x and the so‑called First Look sensor from PicoScope.
The diagnosis can also be refined using less extensive measuring equipment. With a classic cylinder leak tester, compressed air is applied to the cylinder. Depending on the location of the leak, a hissing or whistling sound can then be heard in the intake port, the exhaust port or the crankcase ventilation. In the case of a leak towards the cooling system, air bubbles may also become visible in the coolant reservoir. The escaping air from the cylinder will always manifest itself at one of these locations.
When there is a possibility of engine damage, an endoscope can additionally be used to look inside the cylinder. This allows visible deviations of the valves, the piston or the cylinder wall to be identified.
Pressure trend during cranking with a restricted intake:
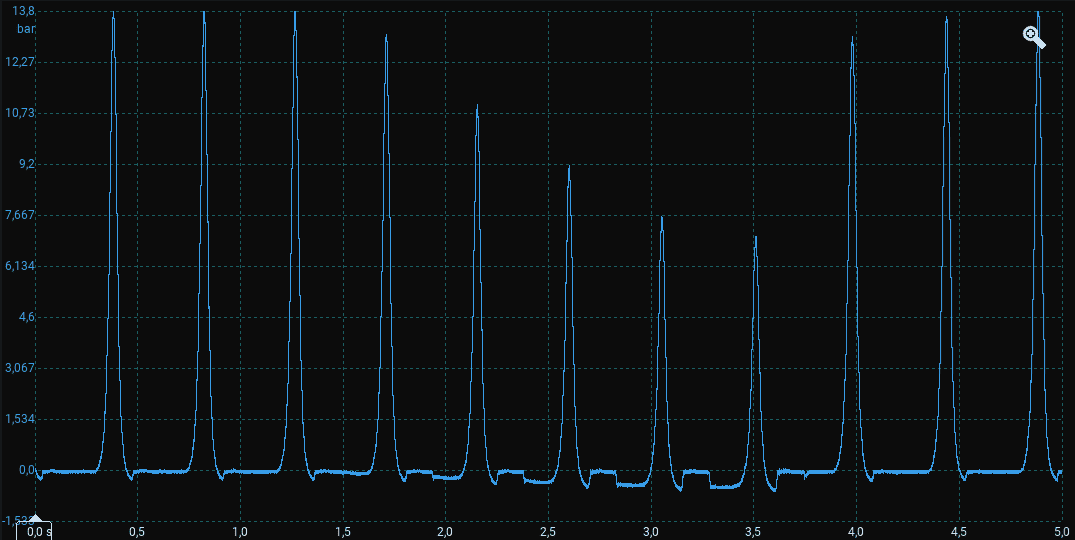
When there is a restriction in the intake port, a higher vacuum is created during cranking at the moment the piston draws in air. As a result of the higher vacuum, the volumetric efficiency is lower. To provide insight into what happens to the air pressures, in this experiment the intake port was restricted by sealing it off. These effects can be seen in the scope capture below.
- Between t = 0 and 1.5 seconds we see a normal pressure curve;
- After the compression stroke (after t = 1.5 s) the air pressure during the intake stroke starts to drop. This drop continues every intake stroke until t = 3.5 s.
- From t = 1.5 s the end‑of‑compression pressure also starts to drop to about 7 bar at the lowest compression peak;
- After t = 3.5 s the air supply is opened again and we see the vacuum during the intake stroke become less strong and the end‑of‑compression pressure rise.
Below the same scope capture is shown again, but now with rulers in order to see the pressure difference in the intake accurately. Due to the restriction in the intake, the difference between the “normal” and abnormal intake stroke amounts to almost 470 mbar.
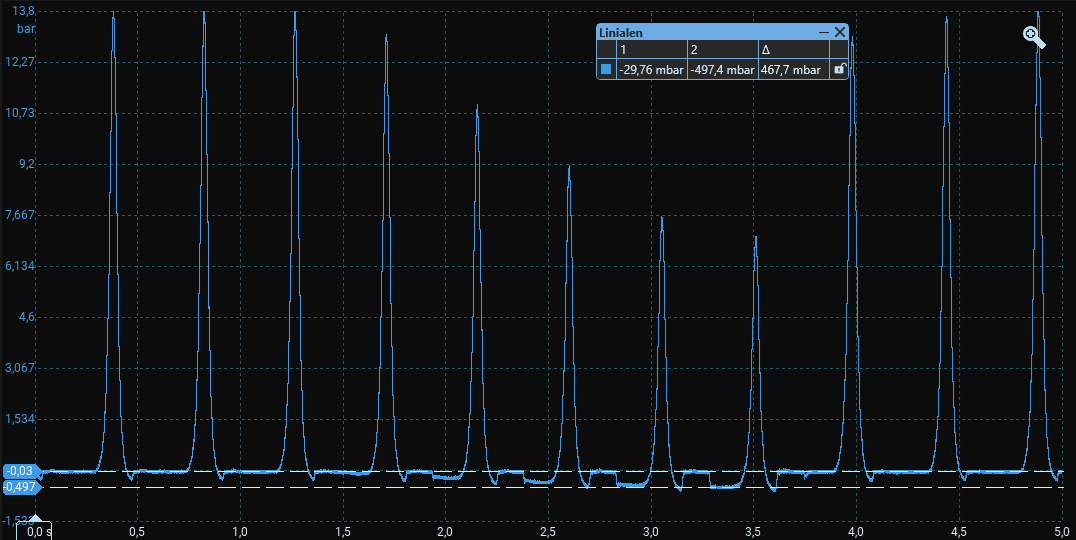
In this experiment the restriction was applied and removed in order to see the irregularities in the signal in the meantime. When a pressure measurement is taken on an existing problem, the ‘higher vacuum’ and ‘lower end‑of‑compression pressure’ will be present throughout the entire measurement.
Practical examples of a restricted intake can be the result of:
- Worn intake cams causing the valve lift to be minimal;
- Excessively large valve clearance adjustment causing the intake valve to stay open too briefly;
- Incorrect valve timing, possibly due to incorrect camshaft (VVT) adjustment;
- An object in the intake blocking the airflow, such as a swirl flap (butterfly valve) that has broken loose from its position in the variable intake manifold;
- Intake tract clogged with carbon due to extreme engine contamination;
- Worn (and therefore flexible) intake hose that is sucked closed by vacuum;
- Throttle does not open fully due to a defective actuator or mechanical restriction;
- Heavily contaminated or incorrectly installed air filter.

The above practical examples may apply to just one cylinder or to all cylinders. If the problem is not present on other cylinders, causes such as a contaminated air filter can already be ruled out.
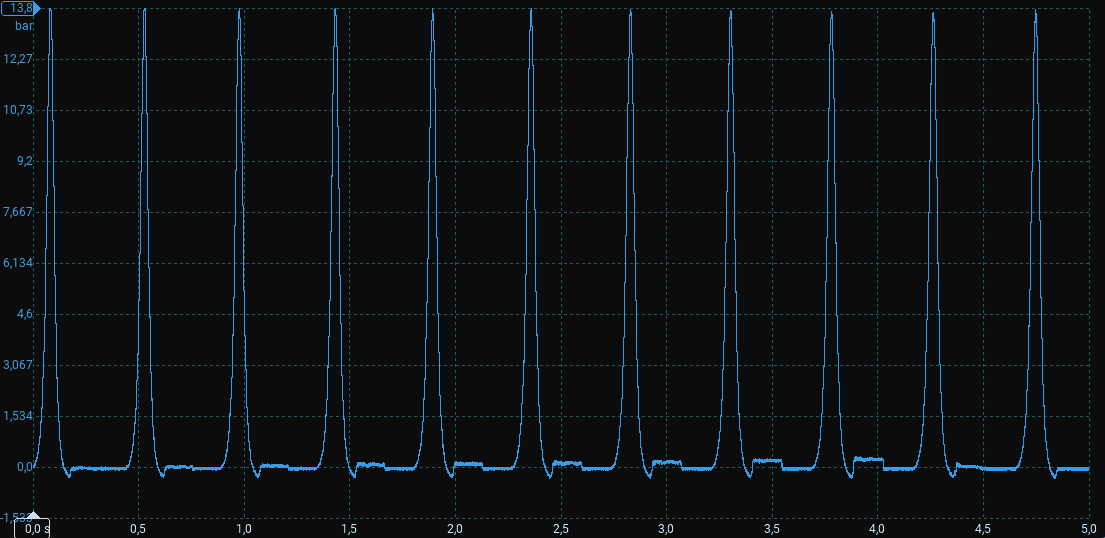
Pressure trend during cranking with a restriction in the exhaust:
Again, during cranking with the throttle open we can see the end‑of‑compression pressure at each compression stroke in the scope capture. During this experiment the flow of the exhaust gases was blocked. This creates a higher back pressure in the exhaust – and therefore also in the cylinder during the exhaust stroke. We see the pressure peaks in scope capture 1 from t = 0.5 s. At this point we already see a slight increase in the back pressure. This back pressure continues to increase up to t = 4 s. From that moment on, the blockage in the exhaust is removed.
Practical examples of a restriction in the exhaust can be the result of:
- Worn exhaust cams causing the valve lift to be minimal;
- Valve clearance set far too wide, causing the exhaust valve to stay open too briefly;
- Incorrect valve timing of the exhaust camshaft, with the intake camshaft correctly timed (otherwise no proper compression pressure can be created);
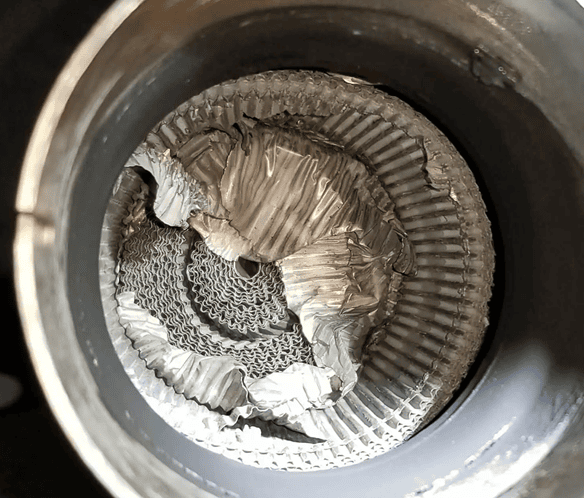
- Defective catalytic converter that partially or completely obstructs the flow of exhaust gases (see the image);
- Partially detached internals in a muffler;
- Clogged muffler or kinked exhaust as a result of a collision;
- On heavy‑duty diesel engines, a sticking exhaust brake valve;
- A defective turbocharger where the exhaust gases cannot exit the turbo via the turbine wheel or via the wastegate, or a combination of both.