Topics:
- Introduction to gear ratios
- Forces at the wheels
- Determining the K-factor according to the geometric series
- Determining the K-factor according to the corrected geometric series (Jante series)
- Determining gear ratios (introduction)
- Calculating the reduction of 1st gear
- Calculating the reduction of 5th gear (according to the geometric series)
- Calculating the remaining reductions (according to the geometric series)
- Calculating reductions according to the corrected geometric series (Jante series)
- Calculating vehicle speed per reduction (geometric series)
- Calculating vehicle speed per reduction (corrected geometric series)
Introduction to gear ratios:
The gear ratio is determined by:
- The number of teeth on the gears (such as in the gearbox)
- The diameter of the pulleys (such as the components driven by the multi-rib belt)
In the image you can see that gear A has 20 teeth and gear B has 40 teeth. The ratio is 40/20 = 2:1.
That means that gear A (driving) makes two revolutions while gear B makes one revolution. In practice this is almost never the case. A ratio is always chosen that is never exactly 2.00:1, because in that case the same teeth would mesh with each revolution. If gear B had 39 teeth (1.95:1) or 41 teeth (2.05:1), the gears A and B would mesh one tooth further with each revolution, causing wear to be 20 times less than with the 2:1 ratio.
A high gear ratio (where the driving gear is small and the driven gear is large) gives a high top speed and a low gear ratio gives more tractive force. In the gearbox of a car (in principle all motor vehicles), the design takes into account the purposes for which the car will be used. A vehicle that is mainly intended to carry a heavy load will need more tractive force at low gears than a sports car that must be able to reach a high top speed. The gear ratio of the highest gear must be designed in such a way that the maximum engine speed can be reached at the engine’s maximum power. It would be a waste if the engine speed is already at the limiter while there is still enough power reserve available to continue accelerating. Besides the highest gear, the lowest gear must also be chosen carefully; the car must be able to pull away in first gear on a 40% gradient without any problems, even under the worst conditions. In addition, the ratios of the intermediate gears, i.e. 2, 3 and 4 (and possibly also 5 in the case of a 6-speed gearbox) must be determined in between.
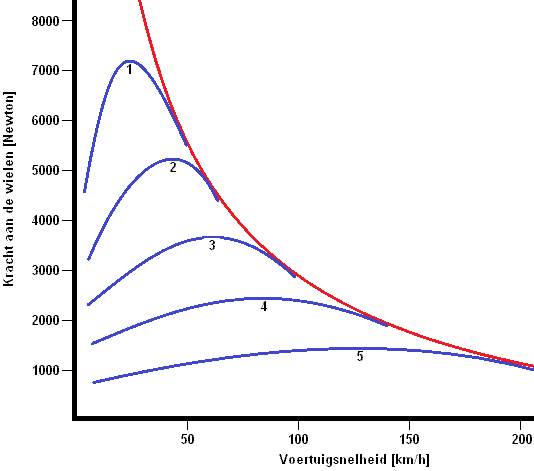
Forces at the wheels
In the graph (in the image) the engine characteristics are shown with the blue lines and the vehicle characteristics with the red line. It can clearly be seen that 1st gear delivers a high force at the wheels (approximately 7200 N, i.e. 7.2 kN) and that in the highest gear (5th) a maximum force of 1500 N is delivered at the wheels.
As the vehicle speed and the gears increase, the force delivered at the wheels decreases. The course of the blue lines is a consequence of the gear ratios and the descending red line is the result of the driving resistances (rolling and air resistance).
Determining the K-factor according to the geometric series:
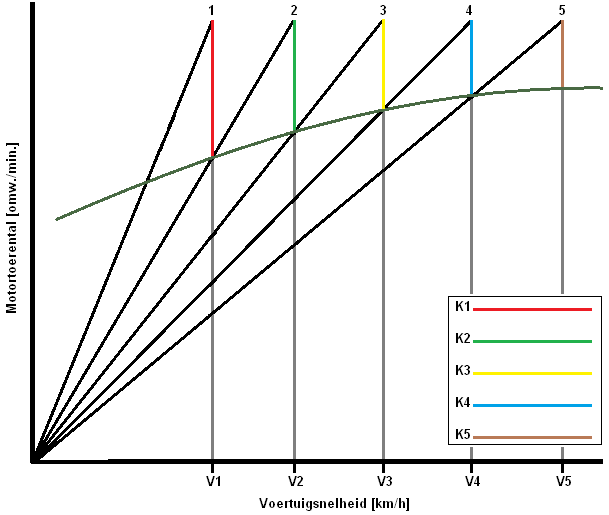
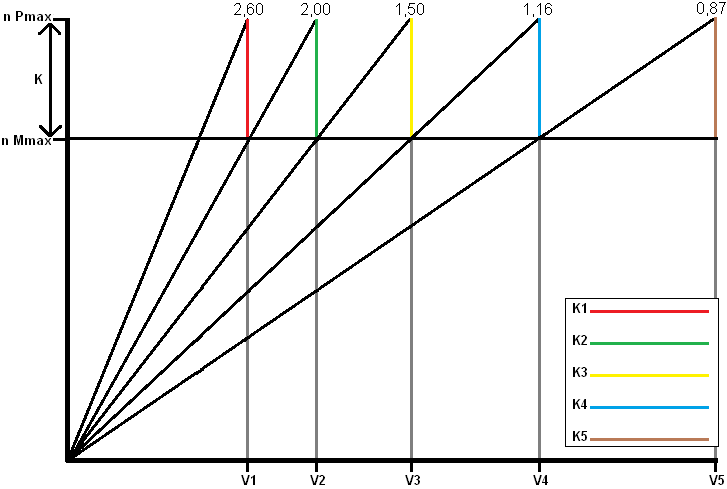
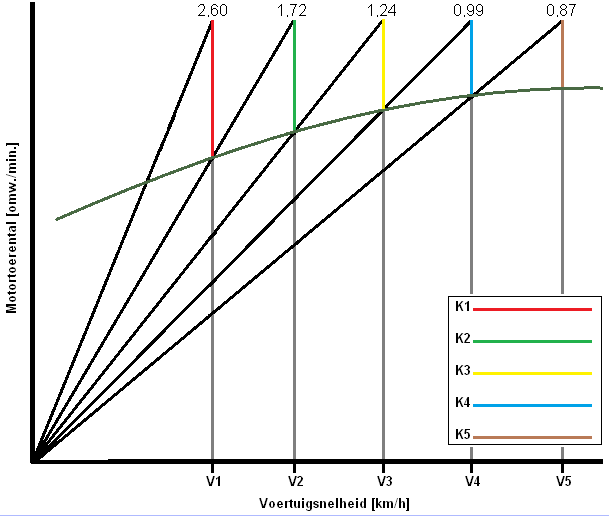
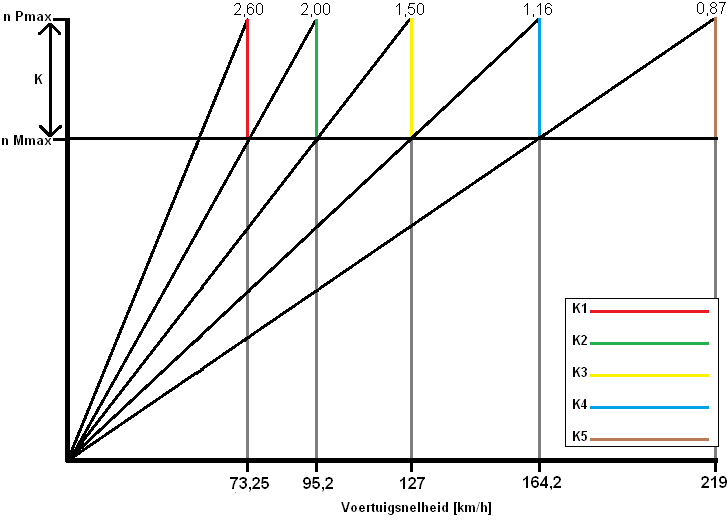
The following text relates to the sawtooth diagram below.
When accelerating in first gear up to the maximum engine speed, you then have to shift to 2nd gear.
After shifting and disengaging the clutch, the engine speed will have dropped and the vehicle speed will still be the same. At the moment you shift from 1st to 2nd gear, the engine speed follows the red line in the graph below. The engine speed will drop from “n Pmax” to “n Mmax”.
The coloured lines outline the K-factor. The magnitude of the K-factor determines the length of the coloured lines. If “n Mmax” and “n Pmax” are close together, the K-factor is small. The gaps between the gear ratios are then smaller.
The same applies to the other gears. When accelerating up to “n Pmax” in 2nd gear (up to V2), the green line down to “n Mmax” is followed when shifting up.

- n Pmax: The engine speed at which maximum power is achieved (e.g. 6000 rpm) with “n Pmax” as the “speed at maximum power”
- n Mmax: The engine speed at which maximum torque is achieved (e.g. 4000 rpm) with “n Mmax” as the “speed at maximum torque”
The relationships between the engine speeds and the gears remain the same. All coloured lines (K1 to K5) therefore also remain the same. The K-factor is determined by the engine characteristics. The K-factor lies between the engine speeds of the engine’s maximum torque and maximum power. The gearbox ratios are thus calculated on the basis of these engine characteristics. For the geometric series, the K-factor can be determined as follows:
K = n Pmax / n Mmax
K = 6000 / 4000
K = 1.5
Using the K-factor of 1.5, the reductions (gear ratios) of all gears are determined. In this way they are all matched to each other. The geometric series is not applied to passenger cars because of the gaps that are too large in the higher gears. The gearboxes of passenger cars are designed according to the corrected geometric series (the Jante series).
Determining the K-factor according to the corrected geometric series (the Jante series):
In passenger cars, the gaps between the low gears are often large and become increasingly smaller at the higher gears. Small gaps between the high gears result in little loss of acceleration. The ratios in the higher gears become smaller and smaller, so that the engine power is used to the full. You can also notice this; between shifting from 1st to 2nd gear the engine speed drops further than between shifting from 3rd to 4th gear. This is visible in the sawtooth diagram below; the red line is longer than the yellow line:
The arithmetic series is also called “the Jante series”. It is a corrected geometric series.
The K-factor differs between all gears. This has major advantages compared to the previously mentioned geometric series with the fixed K-value. Because the ratios in the higher gears become increasingly smaller, the engine power is used to the maximum. The force at the wheels is now greater than with the geometric series.
The K-factor is now different for each gear (all coloured lines have a different length), so each one must be determined by calculation. Using the K-factor, the gear ratios of the gears can be determined. Even without knowing the K-factor, the reduction of the lowest or highest gear can be determined, but the remaining gears must then be calculated using the K-factor. Only then can the sawtooth diagram be drawn.
Determining gear ratios (introduction):
The designer of the gearbox has to take a number of factors into account. The ratios in the gearbox must be compiled carefully. Factors such as the engine speeds at which the engine has the most torque and power, the dynamic tyre radius, the reduction of the differential and the efficiency of the entire drivetrain are important. These are listed below:
The engine speeds at which the engine has the most torque and power:
These are the engine speeds “n Pmax” and “n Mmax” shown in the image of the geometric series above.
The dynamic tyre radius:
This is the distance between the centre of the hub and the road surface. The smaller the wheel, the higher the wheel speed will be at the same vehicle speed. The dynamic tyre radius can be calculated as follows (if it is not already known):
The tyre size must be known in order to calculate this. As an example, we take a tyre with size 205/55R16. That means that the tyre height is (205 x 0.55) = 112.75 mm = 11.28 cm. Because it is 16 inches, this must be converted to centimetres: 16 x 2.54 (inch) = 40.64 cm.
We are interested in the distance between the road surface and the hub, so the total height of 40.64 cm still has to be divided by 2: 40.64 / 2 = 20.32 cm.
The dynamic tyre radius (Rdyn) is now: 11.28 + 20.32 = 31.60 cm.
The reduction of the differential:
The differential always has a fixed gear ratio. The gearbox must be matched to that. Commercial vehicles can have up to 5 differentials in the drivetrain.
The efficiency of the total drivetrain:
Because of, among other things, friction losses, there is always a certain percentage of loss. This also depends on the viscosity of the oil (and the temperature). Usually the efficiency is around 85 to 90%.
We will now determine the gear ratios (reductions) of a fictitious engine and gearbox.
The following specifications are known:
- Vehicle mass: 1500 kg
- Acceleration due to gravity (G): 9.81 m/s2
- Type of gearbox: Manual with 5 forward gears and a reverse gear
- Dynamic tyre radius: 0.32 m (= 31.60 cm from the previous calculation)
- Differential reduction: 3.8:1
- Drivetrain efficiency: 90%
- Maximum vehicle speed: 220 km/h (220 / 3.6 = 61.1 m/s)
- Maximum gradient: 20%
- Rolling resistance coefficient (μ): 0.020
- n Pmax: 100 kW at 6500 rpm
- n Mmax: 180 Nm at 4500 rpm
First we have to determine how much torque the wheels can transmit to the road surface. This depends on the conditions the vehicle is in; for example, is it driving on an asphalt road with a low rolling resistance coefficient? Together with the rolling resistance and the dynamic tyre radius this can be calculated. The formula for the rolling resistance is as follows:
Frol = μ x m x g x cos α (for an explanation, see the page driving resistances)
Frol = 0.020 x 1500 x 9.81 x cos 18 = 279.9 N
Because there is a gradient present, Fgradient must also be calculated:
Fhelling = m x g x sin α
Fhelling = 1500 x 9.81 x sin 18 = 4547.2 N
The air resistance can be neglected, so the total driving resistance is as follows:
Frij = Frol + Fhelling
Frij = 279.9 + 4547.2 = 4827.1 N
To calculate the maximum torque that the wheels can transmit to the road surface, Frij must still be multiplied by the dynamic tyre radius
Mwiel = Frij x Rdyn
Mwiel = 4827.1 x 0.32
Mwiel = 1544.7 Nm
K-factor:
We will now calculate the K-factor:
K = n Pmax / n Mmax
K = 6000 / 4500
K = 1.33
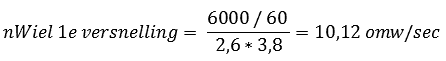
Calculating the reduction of 1st gear:
The formula for calculating the first gear is as follows:
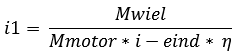
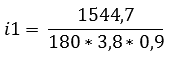
Calculating the reduction of 5th gear (according to the geometric series):
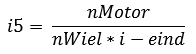
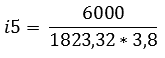
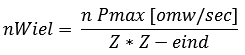
The reduction of 5th gear can also be determined in a similar way. 5th gear must be determined on the basis of the maximum engine speed, because it would be undesirable for the engine to still have sufficient power to continue accelerating while the maximum engine speed (and therefore the car’s top speed) has already been reached. The wheel speed (nWiel) at the maximum vehicle speed is also important. This must be calculated first:
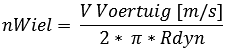
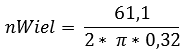
Now that the wheel speed is known at the maximum vehicle speed of 220 km/h (61.1 metres per second), the reduction of 5th gear can be calculated.
Calculating the remaining reductions (according to the geometric series):
According to the calculations, the reduction of 5th gear is 0.87 and the K-factor = 1.33.
With this data, the reductions of 2nd, 3rd and 4th gears can be calculated (according to the geometric series).
i5 = (has already been calculated)
i4 = K x i5
i3 = K x i4
i2 = K x i3
i1 = K x i2
The reduction i1 is already known here, so if the rest has been calculated correctly, the same number (namely 2.51) should result. A small deviation is normal, because many roundings were made in between. The series of all reductions can now be filled in. The calculation must be done from bottom to top. The answer of i5 is used for i4, and of i4 for i3, etc.
i5 = 0.87
i4 = 1.33 x 0.87 = 1.16
i3 = 1.33 x 1.16 = 1.50
i2 = 1.33 x 1.50 = 2.00
i1 = 1.33 x 2.00 = 2.60
The table of the geometric series can now be filled in.
Calculating ratios according to the corrected geometric progression (Jante series):
Earlier on this page the difference between the geometric progression and the “corrected” geometric progression was explained. The corrected geometric progression, also called the “Jante series”, has the advantage that the K-factor for the higher ratios lies closer together. The K-factor in the geometric progression was constant (this was n P max divided by n M max, and amounted to 1.33). This also produced a constant value in the graph.
In the corrected geometric progression, there is a line in the graph that shows that the K-value is not constant. With each gear the K-factor becomes smaller.
The corrected geometric progression does have a constant value. We denote this with an m. The value of m = 1.1.
The general formula of the K-value of the corrected geometric progression is as follows:
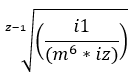
Explanation of the formula:
z-1 = the number of gears minus one
i1 = ratio of first gear
m to the sixth power = constant to the 6th
iz = the total number of gears
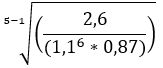
Tip: enter the fourth root into the calculator as follows: first press 4, then SHIFT followed by the root symbol with an x above it (x√). Then pay attention to the use of brackets for the correct order of operations (mvdwao).
The answer to the above calculation is: 1.14
The K-value of the corrected geometric progression is therefore 1.14. We will continue calculating with this:
i5 = (calculated earlier)
i4 = K x i5
i3 = K2 x m x i5
i2 = K3 x m3 x i5
i1 = K4 x m6 x i5
i5 is known; this is 0.87. The K-value is 1.14 and m is 1.1. With this data we can fill in the table:
i5 = 0.87
i4 = 1.14 x 0.87
i3 = 1.142 x 1.1 x i5
i2 = 1.143 x 1.13 x i5
i1 = 1.144 x 1.16 x i5
i5 = 0.87
i4 = 0.99
i3 = 1.24
i2 = 1.72
i1 = 2.60
The table of the corrected geometric progression can now be filled in:
Calculating vehicle speed per ratio (geometric progression):
The vehicle speed can be determined per ratio. This is the speed that the vehicle can reach at most in this gear at the maximum engine speed of 6000 revolutions per minute. The calculation is as follows:
Vvehicle 1st ratio = 2 x π x nWheel x Rdyn
(nWheel has just been calculated for first gear and Rdyn was already known; this is 0.32m. The formula can then be filled in:
Vvehicle 1st ratio = 2 x π x 10.12 x 0.32
Vvehicle 1st ratio = 20.35 m/s x 3.6 = 73.25 km/h
The other gears can easily be calculated by changing the Z = 2.60 in the first formula to the ratio of the desired gear, and then entering this as nWheel in the second formula.
The other gears have the following result:
2nd gear: 95.2 km/h
3rd gear: 127 km/h
4th gear: 164.2 km/h
5th gear: 219 km/h (this is the top speed of the car)
These speeds can be entered into the table of the geometric progression.
Calculating vehicle speed per ratio (corrected geometric progression):
The calculation is exactly the same and is therefore no longer written out.
1st gear: 73.2 km/h
2nd gear: 110.75 km/h
3rd gear: 153.61 km/h
4th gear: 192.40 km/h
5th gear: 219 km/h
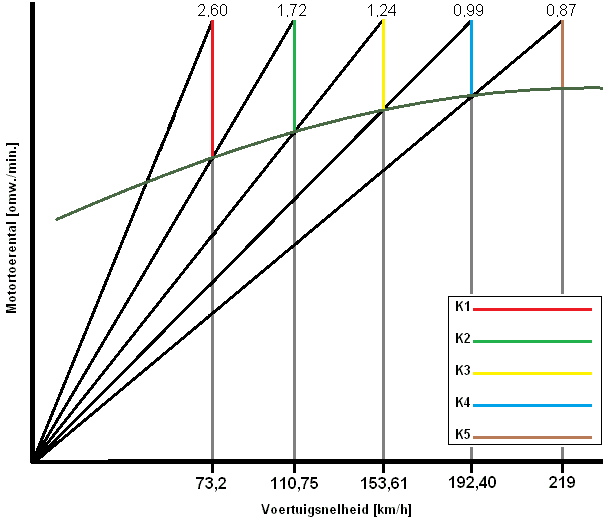
As can now clearly be seen, the top speeds of the car are the same for both the geometric and the corrected geometric progression. In the geometric progression (the first one) the gaps between the higher gears are very large and in the corrected geometric progression the gaps between all gears are almost equal. The latter is used in modern vehicles.