Introduction:
This page discusses the consequences for transport and mobility and a number of alternatives, where in 2021 people are taking the path toward environmentally friendly solutions. The powertrains of passenger cars and commercial vehicles are increasingly being electrified to emit fewer to no harmful substances. The shift from fossil fuels to fully electric propulsion falls under the so-called “energy transition”.
The European Union wants to ban the sale of vehicles with petrol and diesel engines from 2035. All new vehicles must be equipped with a fully electric powertrain in the form of a BEV or with a fuel cell. A number of countries, including the Netherlands, intend to ban the sale of new vehicles with internal combustion engines as early as 2030. Countries such as France and Germany, on the other hand, are strongly opposed to these plans: they prefer a transition to hybrid powertrains in order to significantly reduce the emissions of the vehicle fleet, but not to fully electrify it.
Climate change:
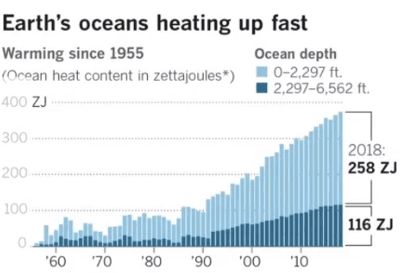
It has been scientifically proven that climate change is caused by humans. Since the industrial revolution, especially from the 1950s onwards, fossil resources such as oil and gas have been burned on a large scale. The burning of oil and gas has caused an enormous increase in CO2. Research shows that CO2 emissions lead to global warming. The emissions of so-called “greenhouse gases” are partly responsible for climate change. The temperature in the Netherlands has risen by 1.9 degrees Celsius over the past 130 years. Worldwide, based on the current situation, the temperature will rise by the end of this century to a temperature estimated at a minimum of 1.8 and a maximum of 6.4 degrees Celsius. As the air warms, the oceans steadily warm up. Oceans cool down much less quickly than air, which can fluctuate somewhat in temperature.
The warming of the oceans leads to different warm-water (Gulf) currents. These currents are part of a worldwide “conveyor belt” that circulates cold and warm bodies of water across all the oceans. The Gulf Stream transports a lot of heat and is therefore important for the climate. Especially for our mild Western European climate.
If this Gulf Stream is disrupted or disappears, the pressure difference between the north and south of the Atlantic Ocean will also disappear. As a result, the ocean in the south will drop by half a meter and in the north it will rise by about half a meter. The rising sea level is a concern for our low-lying Netherlands, where about 25% of the country lies below sea level (NAP).
Sea level rise will be between 1 meter and 5 meters by the year 2150. Parts of the world will become uninhabitable due to the higher temperature and sea level rise. There will also be more turbulent weather, because storms, hurricanes and heavy rain showers lead to flooding.
A large part of the Netherlands lies below sea level and is therefore
very vulnerable to flooding. As much as 55% of the Netherlands is sensitive to flooding; 26 percent of the Netherlands lies below sea level and 29 percent is sensitive to river flooding. With dikes to protect the coastal areas and storm surge barriers to keep out (temporary) high water levels, the risk of flooding is reduced.
Source: pbl.nl (consulted in 02-2024)
Gases in the atmosphere:
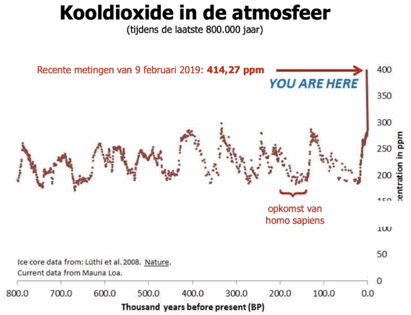
The following image shows a graph of the amount of carbon dioxide in the atmosphere viewed from right to left from the present (0.0) to 800,000 years ago. The CO2 measurements were taken from ice cores in the North and South Poles. In the graph we see fluctuations in the amount of CO2 that have always occurred.
At the low points in the graph, there was an ice age. The last ice age was about 12,000 years ago. After that, the graph rose steeply, as it actually should have remained the same or should have declined. In this period we should actually have had a lower temperature, contrary to what is often claimed: that it should have become warmer. The temperature graph is now shooting up to an extreme height (indicated by “You are here”). Because of the melting ice, such measurements are becoming increasingly difficult to carry out.
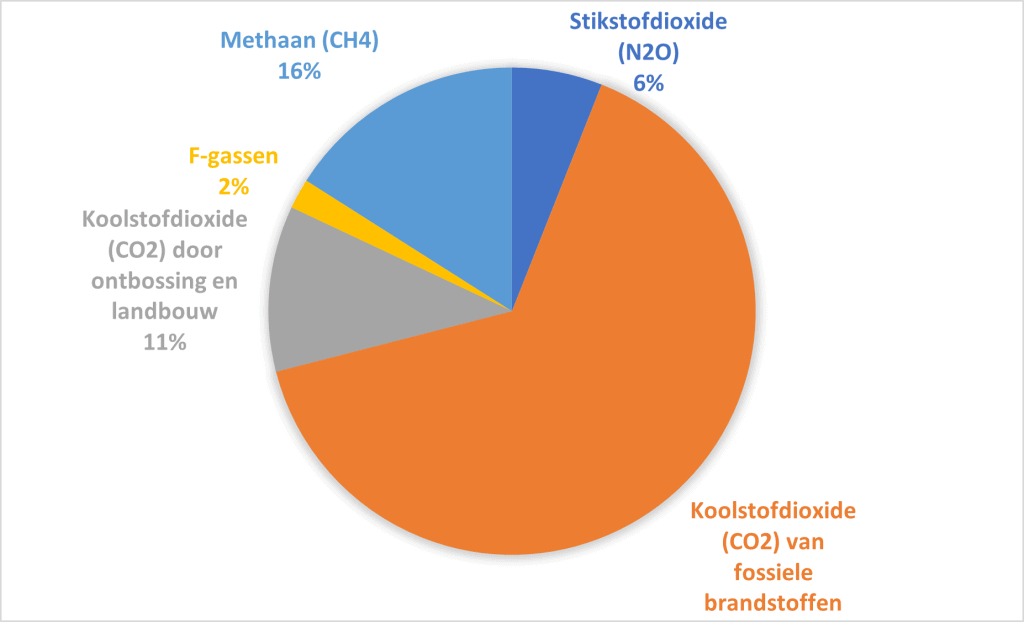
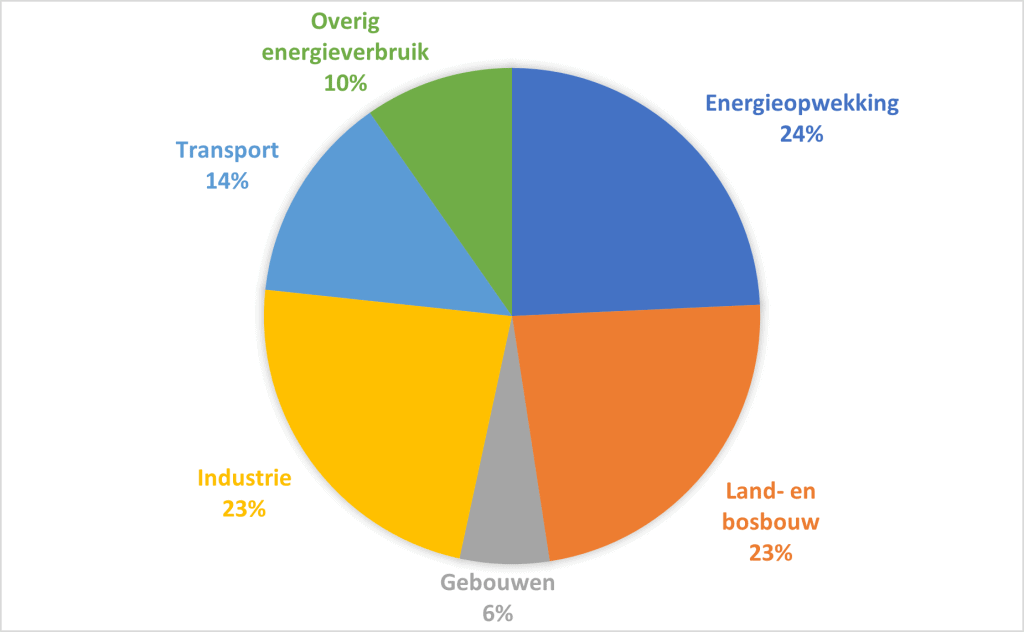
The diagrams below show the amount of harmful gases emitted worldwide (left) and CO2 emissions by sector (right). On this page we focus on transport, which has a share of 14% in total CO2 emissions (as of 2021).
Climate Agreement:
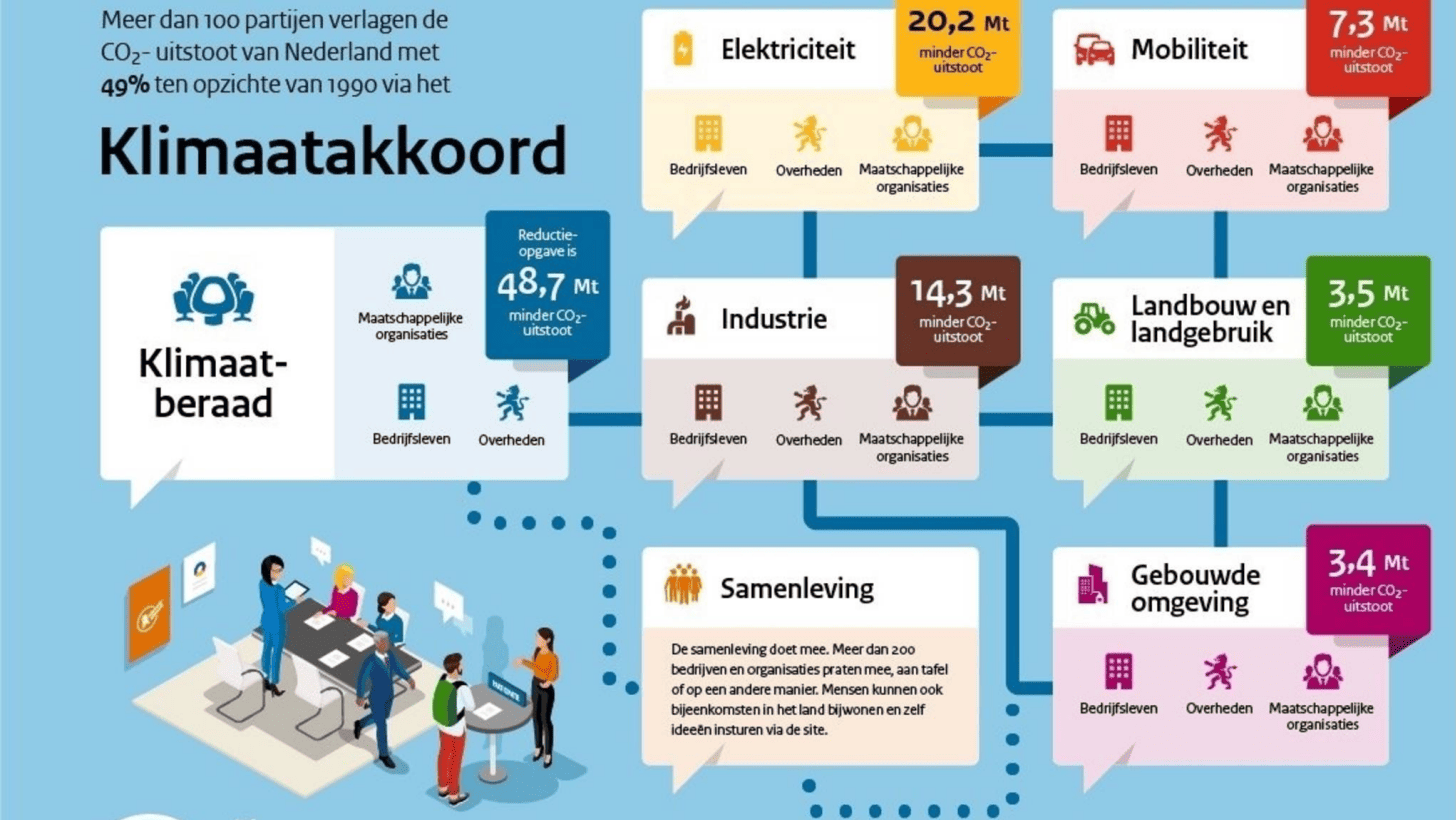
In the Paris Climate Agreement, 195 countries worldwide agreed to significantly reduce CO2 emissions by reducing fossil fuels. According to the Dutch climate agreement of 2019, the goal is to reduce CO2 emissions by 49% by 2030 (increased to 55% due to EU policy). Concrete steps are being taken, such as stricter emission standards for cars. The Netherlands also aims for a reduction of 20.2 megatons of CO2 emissions. This figure indicates the intended reduction over a specific period and aims to reduce total greenhouse gas emissions and limit climate change. The target concerns various sectors, including energy production, transport and industry.
Impact on the mobility sector:
The climate targets set by governments are forcing car manufacturers to further reduce the harmful exhaust emissions from internal combustion engines. An important factor in this is CO2 emissions. In addition, more and more countries are coming up with plans to ban the sale of vehicles with internal combustion engines between 2030 and 2040. This is driving a transition to electrified powertrains:
- hybrid (partly electric in combination with an internal combustion engine);
- fully electric;
- hydrogen and fuel cell.
The maximum emissions of cars (measured in CO2 per kilometer) are becoming increasingly strict. Car manufacturers that do not meet these targets risk significant fines (in 2021: 95 grams of CO2 per kilometer, in 2030: 59.3 grams of CO2 per kilometer). More and more cities are introducing low-emission zones where polluting cars are not allowed. From 2035, only ‘zero-emission’ new cars will be allowed in the Netherlands, meaning they must be battery-electric or hydrogen-electric.
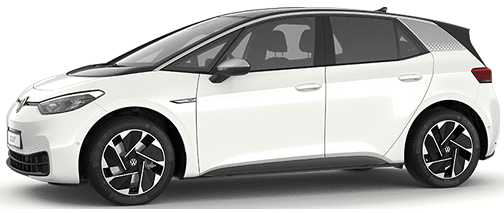
Vehicles with a fully electrified powertrain do not have an exhaust from which harmful exhaust gases come out. These vehicles are labeled as “green”. The range is often limited (80 to 300 km) and the charging times to charge the battery pack are long.
Partly electrified vehicles, such as hybrids, are ideal for driving longer distances. In city traffic you can drive fully electric, or use electric assistance for the internal combustion engine for lower consumption. On the highway the internal combustion engine switches on and you can go on holiday abroad without worries and without long charging times.
But how clean and green is a fully electric car really? Opinions are strongly divided on this. The undersigned objectively highlights the facts.
A fully electric car is not climate-neutral. There are both direct particulate emissions (brakes, tires) and indirect emissions of nitrogen oxides (CO2 and NOx). Various studies do show that a fully electric car is cleaner over its entire lifetime than a car that runs on fossil fuels.
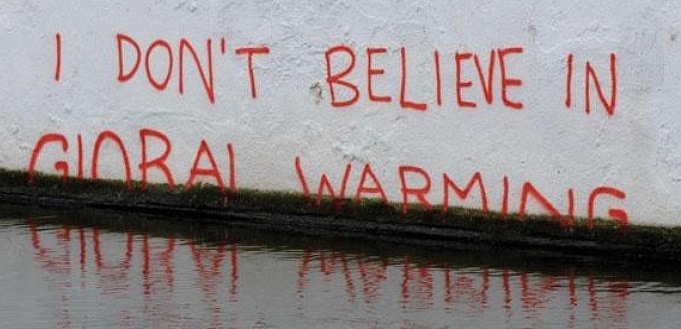
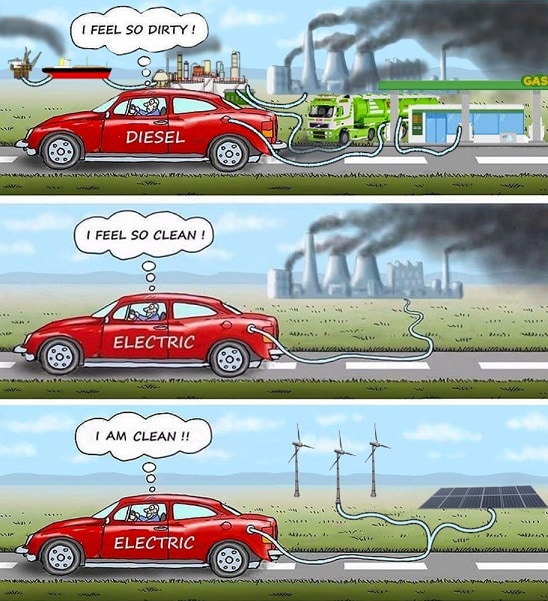
For the CO2 emissions of a fully electric car, 0 grams per kilometer is stated. This is the result of the WLTP test. After all, there are no direct emissions. In the Netherlands, as of 2021, only limited “green” energy is generated, coming from wind turbines and solar panels. Most electricity is generated by burning gas and coal. This results in the comical illustrations below, which unfortunately do contain a kernel of truth.
A fair comparison with fuel cars is only possible when you include the emissions involved in producing the electricity. In addition, the production of batteries and electric motors requires a lot of CO2 and often uses scarce raw materials. In the table below we see the amount of CO2 emissions per liter of petrol, diesel and LPG.

For the CO2 emissions of a fully electric car, 0 grams per kilometer is stated. This is the result of the WLTP test. After all, there are no direct emissions, but CO2 was released in generating the electrical energy. One kilogram of coal delivers a maximum of 3.5 kWh, and when burned, no less than 3.6 kg of CO2 is released.
According to the WTW methodology, all CO2 generated during the exploration, extraction, transport and storage of coal is attributed to coal’s CO2 emissions. This brings emissions to 4.4 kg CO2 per kg of coal.
We are now only looking at the total emissions during combustion, because according to the WTW methodology, CO2 is also produced for petrol and diesel. We see that with the average consumption of the vehicles in question, CO2 emissions per kilometer for an electric vehicle are many times higher than for those running on fossil fuels. Source: AMT 5-2021

Green energy:
With green energy, no CO2 is emitted during generation. In the future, we see that we are increasingly replacing grey energy (from coal) with green energy obtained from wind or solar power.
Only when all of our electricity has been obtained through green energy will driving a fully electric vehicle be clean and “zero emission”.
Below are facts about solar and wind energy.
Solar energy on land:
- 6,000,000 kWh/year = 44,000 m2, i.e. 136 kWh / m2
- More predictable patterns and seasonal.
- Quite scalable;
- Often can be made effectively “invisible” on top of buildings or as a replacement for roof tiles.
Wind energy on land and at sea:
- 60,000,000 kWh/year (190,000 m2), i.e. 32 kWh / m2;
- Less seasonal;
- High capacity per unit;
- Visual pollution on the horizon;
- Require a lot of space (5x rotor diameter) to prevent turbulence between rotor blades.
In summary, the energy yield of solar power per square meter is higher than that of wind power. But because the strength of the sun varies greatly over a period and there is virtually always wind (day, night, summer and winter), wind yield is almost constant. Solar panels are fairly easy to install unobtrusively and expand, while wind turbines are a source of annoyance for people who live close to them, or who can no longer enjoy an unobstructed view over a nature reserve.