Introduction:
The air mass meter is mounted between the air filter housing and the intake manifold.
All of the drawn-in air passes through the air mass meter. In a naturally aspirated engine, the air is drawn in by the vacuum in the cylinders and in an engine equipped with a turbo, the air is drawn in by the compressor wheel. The air mass meter measures the quantity of air flowing into the engine. Based on this data and using the map values in the engine control unit, among other things, the amount of fuel to be injected can be determined.
The air mass meter is available in two versions:
- Analog output signal: the level of the voltage depends on the measured value. This is also called an AM signal (Amplitude Modulation);
- Digital output signal: the electronics in the sensor create a digital signal in the form of a frequency. This FM signal (Frequency Modulation) varies as the air quantity increases.
The following paragraphs explain the difference between analog and digital air mass meters with example measurements. The final paragraph explains the operation of the air mass meter at component level.
Analog air mass meter:
The supply voltage to this sensor is 12 volts. The analog voltage signal from this sensor is generally (depending on make and type) at:
- Ignition on, no air flow: 0.2 – 1.5 volts.
- Engine idling: 1.5 – 3.0 volts.
- Accelerating with throttle fully open: max. 4.5 volts.
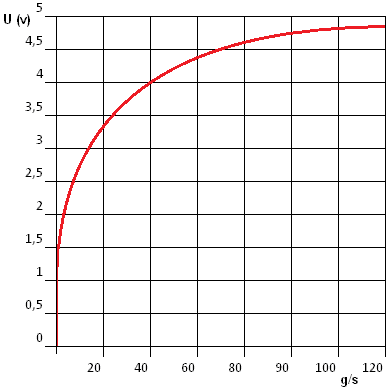
The graph shows the course of the voltage in relation to the measured air mass in grams per second. We can measure the voltage with a multimeter.
Digital air mass meter:
The frequency of the signal indicates how much air has passed the sensor. The voltage of the signal is always between 0 and 5 volts. The frequency indicates how often the signal repeats within a period of one second. When we measure two signals in one second with an oscilloscope, we speak of 2 Hz. In practice we see that the frequency is much higher. In general, manufacturers use the following frequencies:
- idling: 2 – 2.5 kHz (2000 – 2500 Hz)
- high engine speed: up to 6 – 6.5 kHz
The frequency rises in proportion to the increasing air flow. If abnormal peaks are seen in the signal, or if too low a frequency is measured at high engine speed, there may be a contaminated or defective air mass meter. The images below show two measurements of the digital air mass meter.
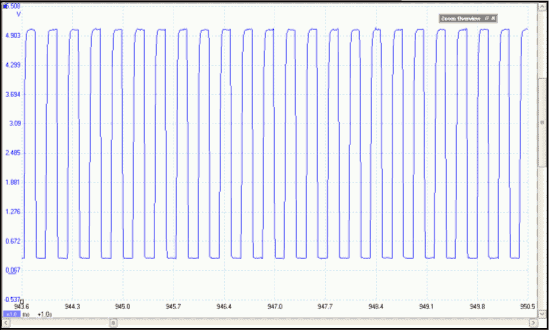
The voltage measurement shows the voltage behaviour over time. In this trace you can see that the voltage constantly changes between 0.5 and 4.5 volts. With an increasing air flow (when raising the engine speed) the time between the rising and falling edges becomes shorter. The pulses become narrower and move closer together. No proper diagnosis can be made from this scope trace.
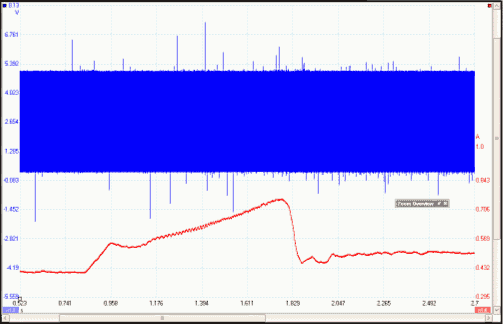
The measurement in which channel A measures the voltage and channel B measures the frequency gives an impression of how the air mass meter operates. The measurement is taken over a longer period of time, which makes it appear as if the blue pulses from channel A are touching each other. This is not actually the case; due to zooming out, there is hardly any distinction to be made between the rising and falling voltages.
The red line (channel B) indicates the frequency of the signal. The closer the voltage pulses are together, the more the red line rises. When you accelerate the vehicle with the throttle fully open up to a high engine speed, the frequency continues to rise until you release the throttle. The height of the red line indicates the maximum frequency of the signal. This data can be compared with the factory specifications or a calculated value. We will look into this in more detail in the next paragraph.
In the diagram below of a Volkswagen Golf 6 2.0 TDI, component code G70 indicates the digital air mass meter.
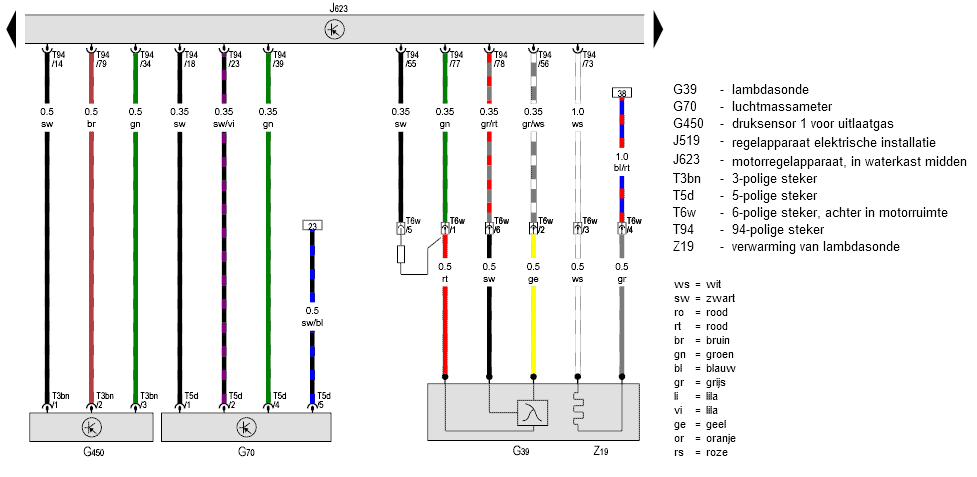
- Pin 1 of the air mass meter is connected to pin 18 of the engine ECU. This is the signal wire over which the air mass meter sends the measured value to the ECU;
- Pin 2: signal wire of the intake air temperature sensor. This sensor is integrated into the air mass meter housing;
- Pin 4: ground;
- Pin 5: is connected to a fuse in the diagram via reference 23. The air mass meter is supplied with a voltage of 12 volts.
At pin 1 of the air mass meter we can measure the signal that is sent to the ECU. In addition, if a breakout box is available, we can check whether this signal also reaches pin 18 of the ECU correctly. If these signals differ from each other, we can measure the voltage difference across this wire (pin 1 of the MAF compared to pin 18 of the ECU).
A supply voltage that is too low for the sensor can affect the sensor signal. Therefore we must also check the positive and ground connections. We connect the voltmeter or oscilloscope to pins 4 and 5 and check whether we measure a voltage that is approximately equal to the battery voltage. If the voltage is too low, we may be dealing with a contact resistance in the positive or ground wire that we can trace using the V4 measurement.
Comparing live data with calculated values in calculator:
The engine management system calculates the drawn-in air mass on the basis of sensor values. With diagnostic equipment this value can be read out via live data (parameters or measuring value blocks). This applies to both analog and digital signals; what is visible is always the value processed by the ECU. To assess whether this value is correct, it can be compared with factory data. Because these are often difficult to obtain, the air mass meter calculator can be used as a reference. The calculated and measured values should reasonably match. Small deviations are allowed due to differences in engine characteristics, such as valve timing and volumetric efficiency. Large deviations (tens of grams) may indicate a defective air mass meter.
The intake manifold pressure (live data from the MAP sensor) represents the engine load:
- idling: around 300 mbar (high vacuum, throttle almost closed)
- partly open: pressure rises, for example towards 600 mbar
- fully open (Wide Open Throttle): around 1000 mbar (ambient air pressure)
Practical check: read out the live data under load during a test drive. Have a colleague monitor the values. For example, drive in 3rd gear and accelerate with full throttle. At a fixed engine speed (for example 3000 rpm), note the air mass, manifold pressure and intake air temperature.
Enter these values into the calculator and compare the calculated air mass with the measured value. If they correspond sufficiently, the air mass meter is functioning correctly. In case of clear deviations, further diagnosis is necessary.
Consequences of a defective air mass meter:
- Less power (may not always be noticeable)
- Lower top speed
- Higher fuel consumption
- More soot emissions (diesel engine)
- Engine struggles to rev up under, for example, full load
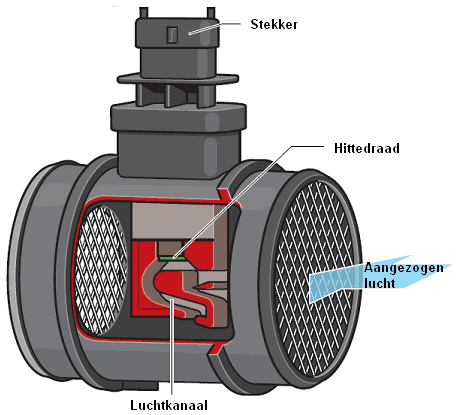
Operation of the air mass meter:
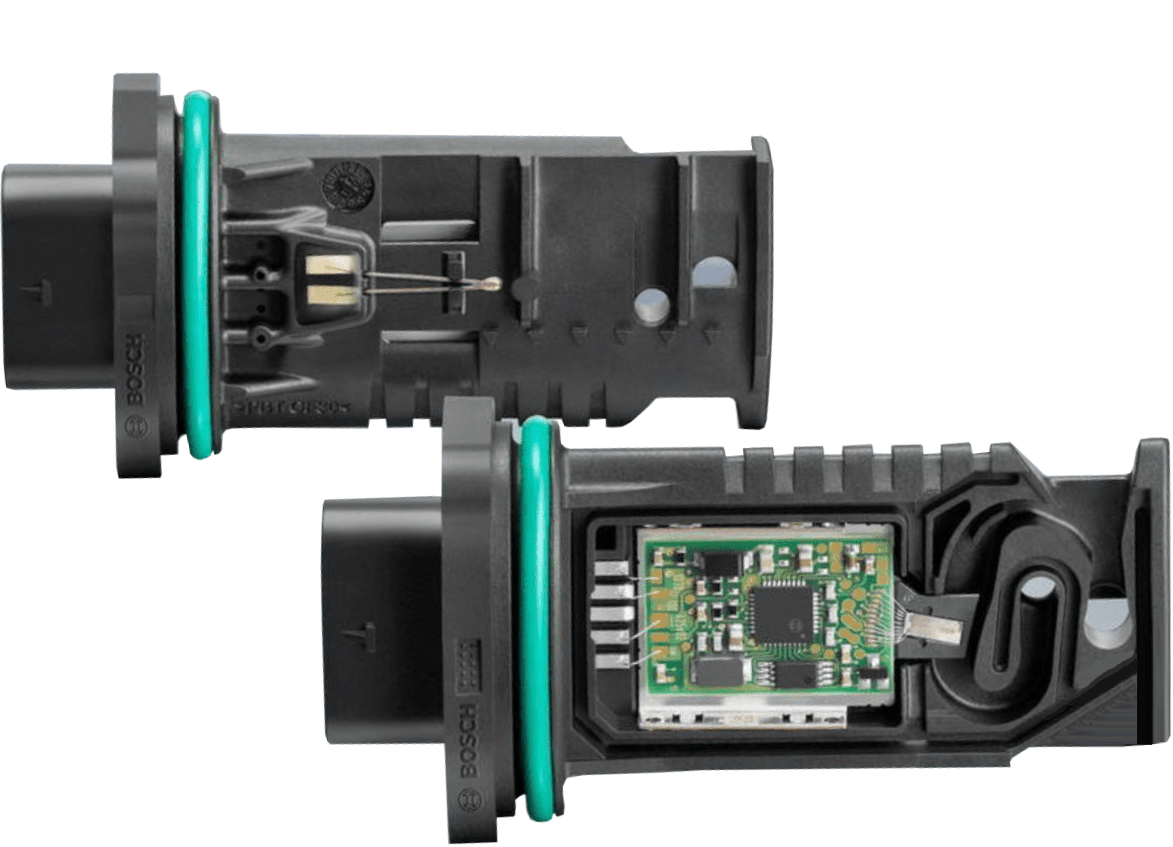
The housing of an air mass meter contains the connector for the wiring harness to the ECU, the electronics on a printed circuit board, and the measuring element.
The rubber O-ring prevents air from being drawn in past the housing. The measuring element of the air mass meter consists, among other things, of two temperature-dependent resistors (PTC and NTC thermistors).
When the engine is running, the resistors cool down due to the intake air flowing past them. The electronic circuit ensures that the temperature of the PTC heating element remains constant. The voltage difference associated with this is translated by an amplifier circuit into a usable output signal to send to the ECU.
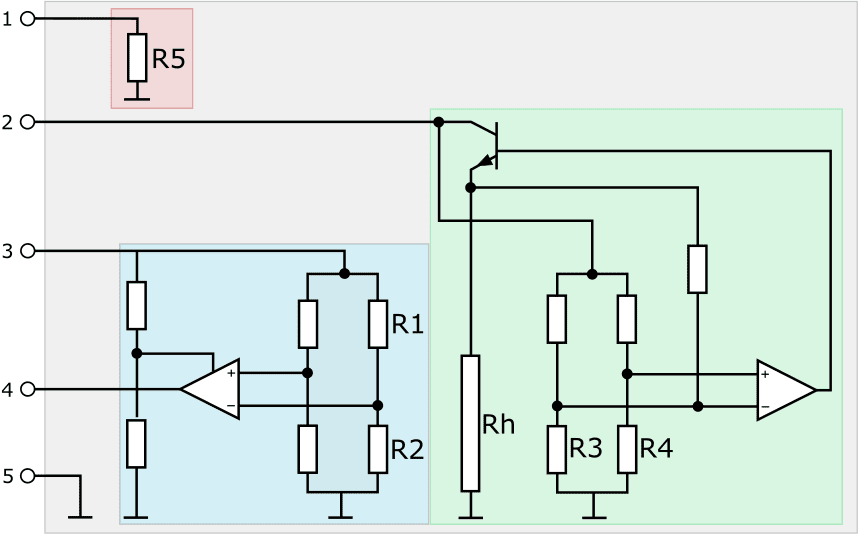
In the following image, the components in the air mass meter are shown in three sub-areas:
- Red: intake air temperature sensor (NTC);
- Green: components for the hot wire;
- Blue: components for the measuring element.
The air mass meter has a 5-pin connector:
- signal intake air temperature sensor;
- supply (12 volts) for hot wire;
- supply (5 volts) for measuring element;
- signal (0.5 – 4.5 volts);
- sensor ground. All internal grounds are connected to this output pin.
In the following images the three sub-areas are shown separately, together with an explanation.
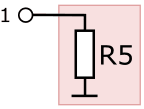
Intake air temperature sensor: as already mentioned, this sensor is of the NTC type.
The sensor resistance depends on the air temperature flowing from the air filter, via the air mass meter, to the turbo or the intake manifold.
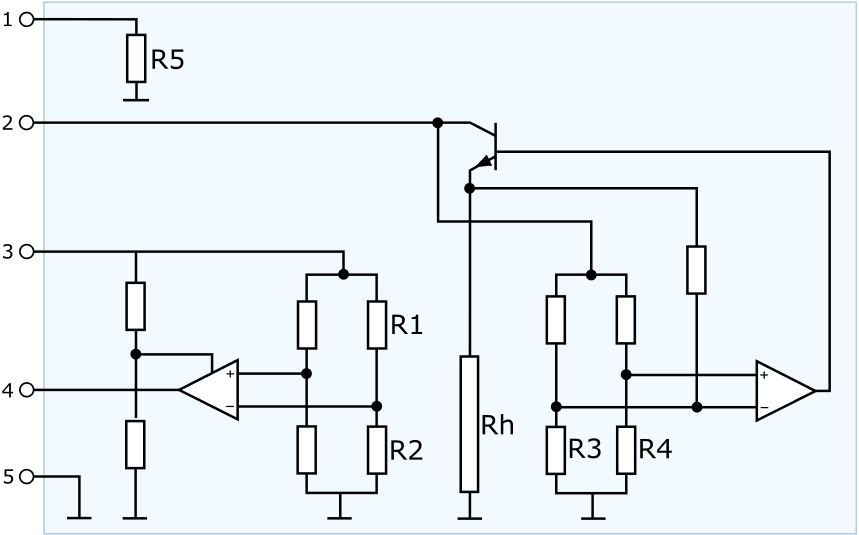
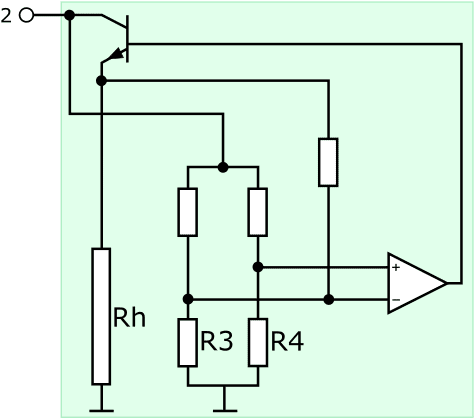
The hot-film air mass meter contains a heating resistor that is kept at a constant temperature. In this diagram the heating resistor is Rh. The heating resistor, also called the hot wire, is switched on and off by a transistor (at the top).
In the middle we see a Wheatstone bridge with the resistors R3 and R4 at the bottom. These are temperature-dependent resistors (PTC and NTC). The resistors R3 and R4 ensure a constant temperature of the heating resistor Rh:
- With an increasing air flow, the resistors cool down and a different voltage drop occurs across all resistors in the bridge. With the Wheatstone bridge, the change in resistance can be converted into a signal voltage for the ECU. See the “Wheatstone bridge” page for a detailed explanation of this circuit.
- Due to the voltage difference at the op-amp, the output voltage to the transistor changes;
- The transistor is driven into conduction and switches the power supply to the heating resistor Rh on or off;
- The heating resistor will be kept at as constant a temperature as possible by the power supply.
- On both sides of heating resistor Rh, the temperature-dependent resistors R1 and R2 are placed;
- If no air flows through the sensor, the resistors R1 and R2 have the same value and there is no output signal;
- If air does flow through the sensor, resistor R1 cools down and R2 is heated;
- As a result, the resistance value of R1 decreases and that of R2 increases;
- Due to the rising resistance value, the output voltage also rises;
- If the air flows back over the sensor (backflow), R2 cools down and R1 is heated, causing the output voltage to drop. The average output voltage is therefore an accurate measure of the amount of air mass flowing to the engine.
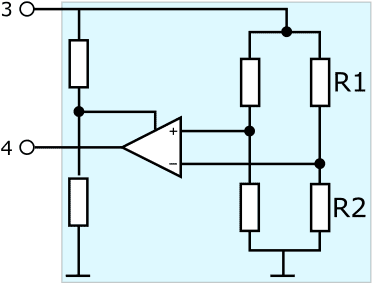
Backflow is the flow of air (pulsations) back towards the air filter as a result of the closing of the inlet valves or the closing of the throttle valve. The backflow is measured as extra air mass, which can cause a large deviation in the signal. Modern mass air flow meters have backflow compensation, as illustrated in this example with the resistors R1 and R2.